The 2023 Year-End Review of our Stratford Real Estate Market Report will examine:
- Number of Sales for Detached, Semi-Detached, Attached, and Condominiums from 2019-2023
- Average Sale Price for Detached, Semi-Detached, Attached, and Condominiums from 2019-2023
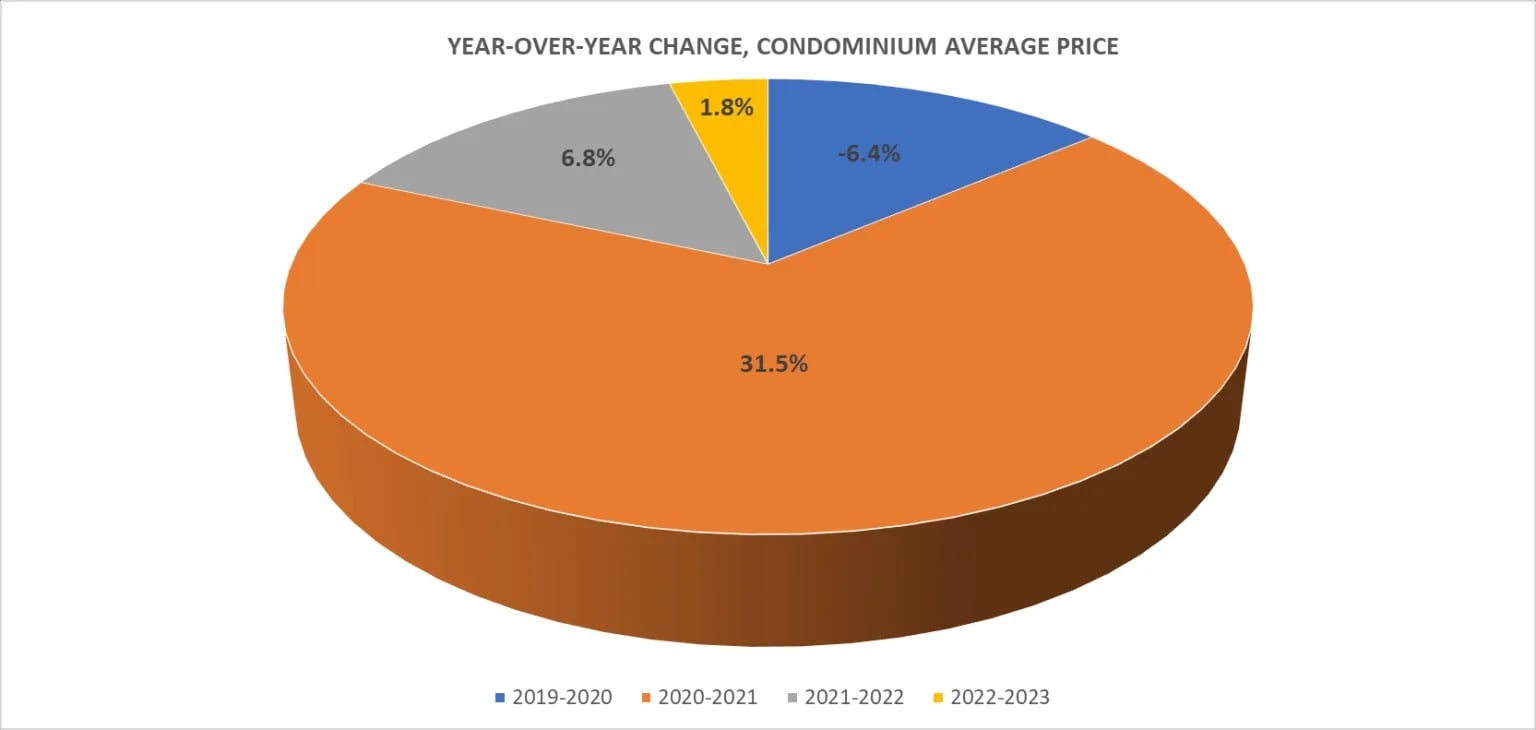
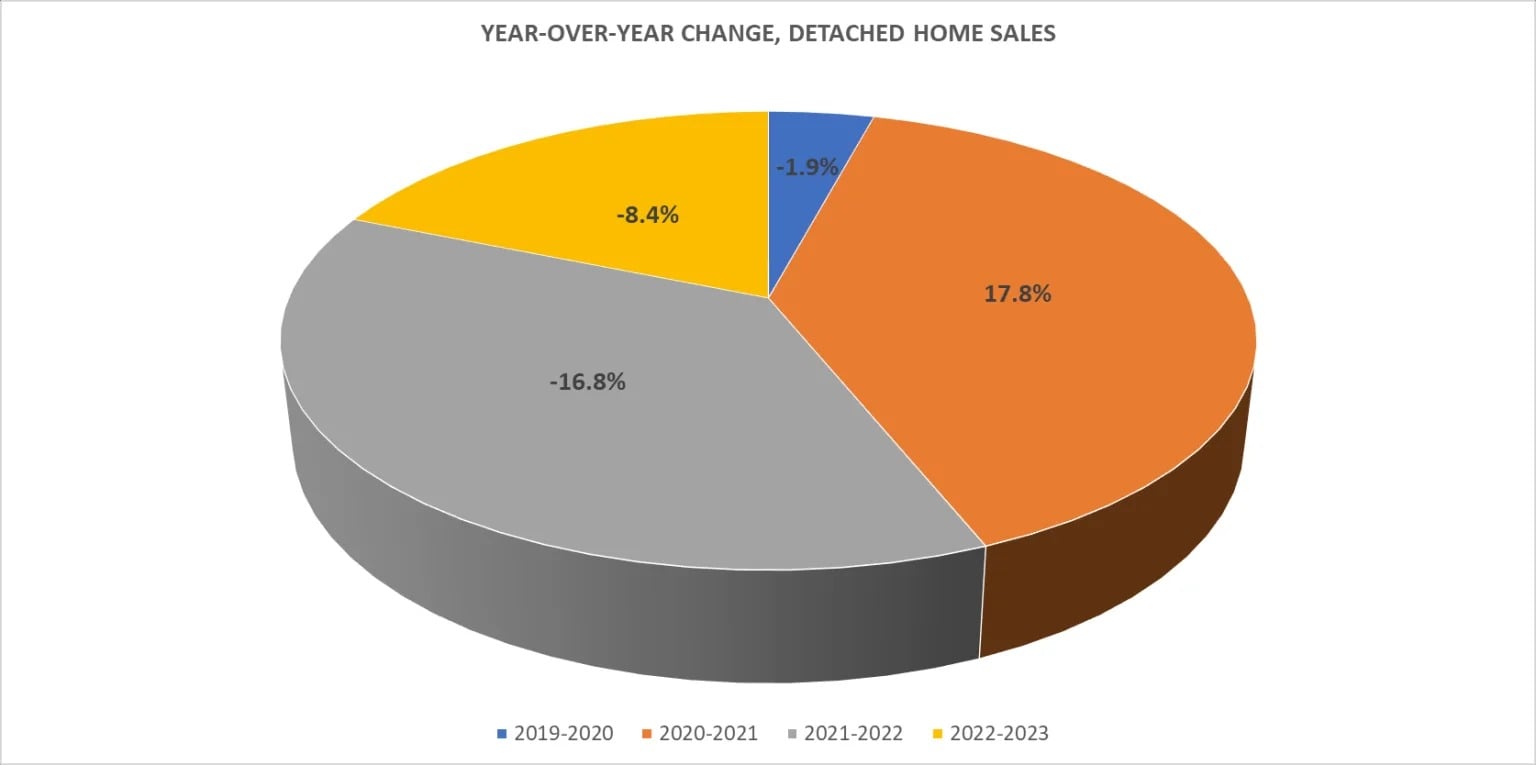
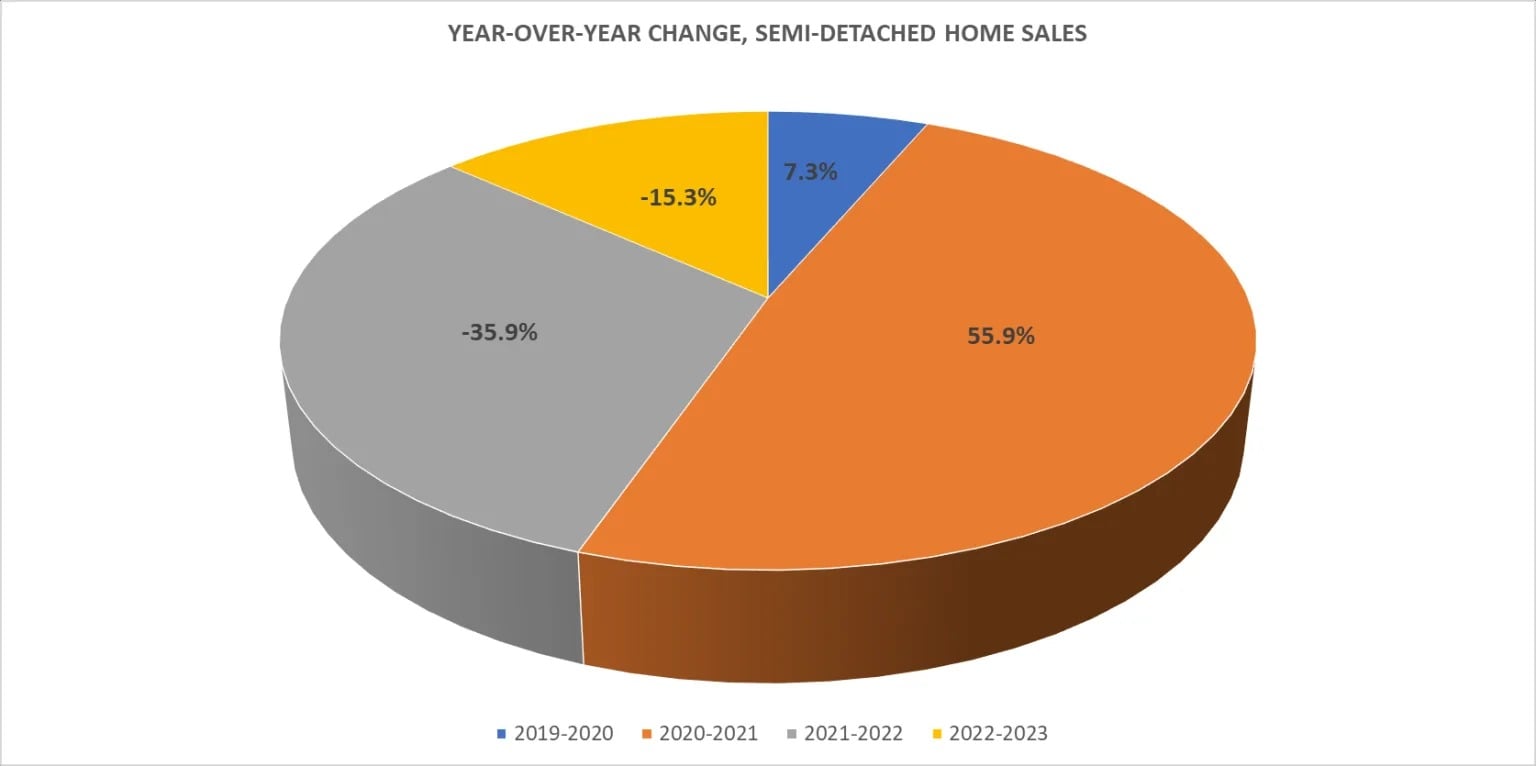
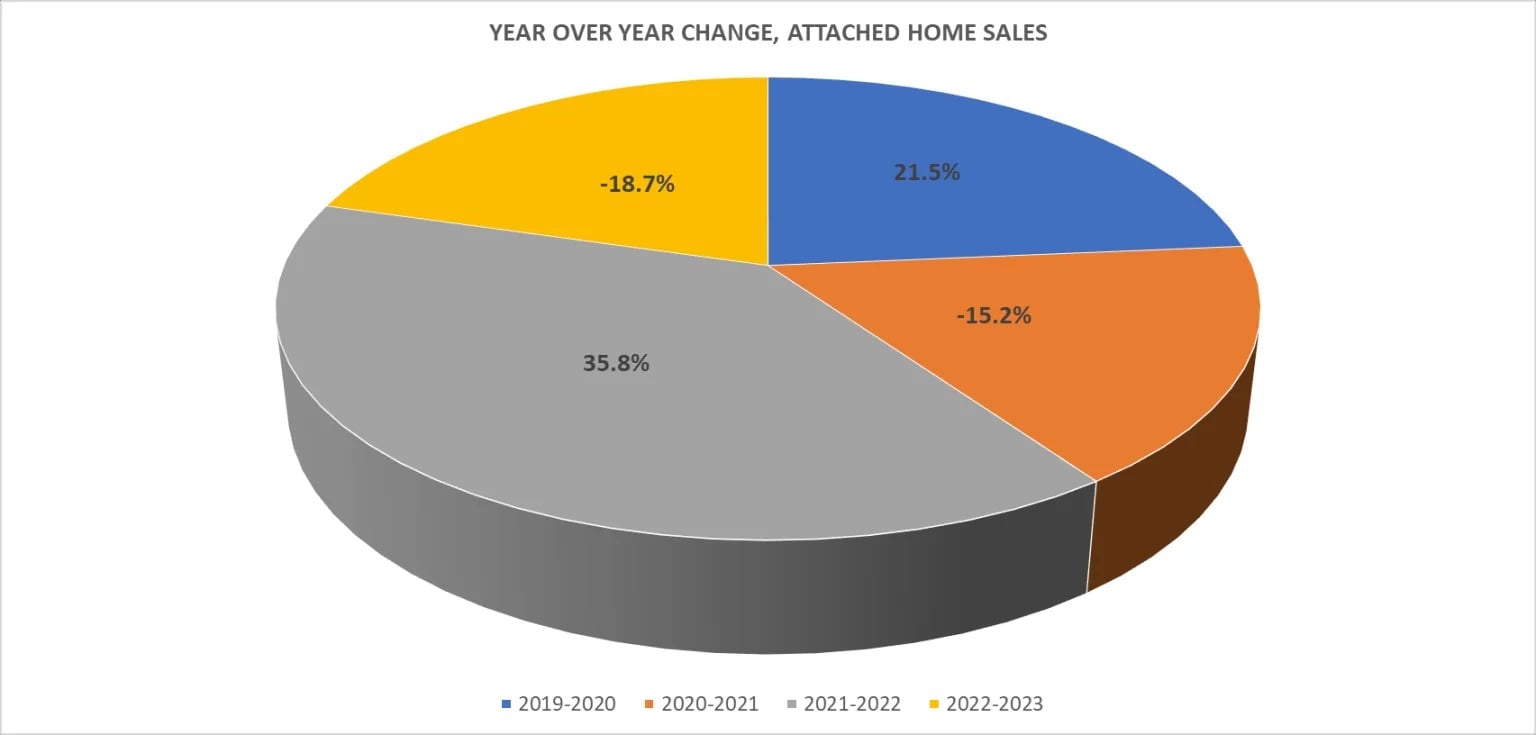
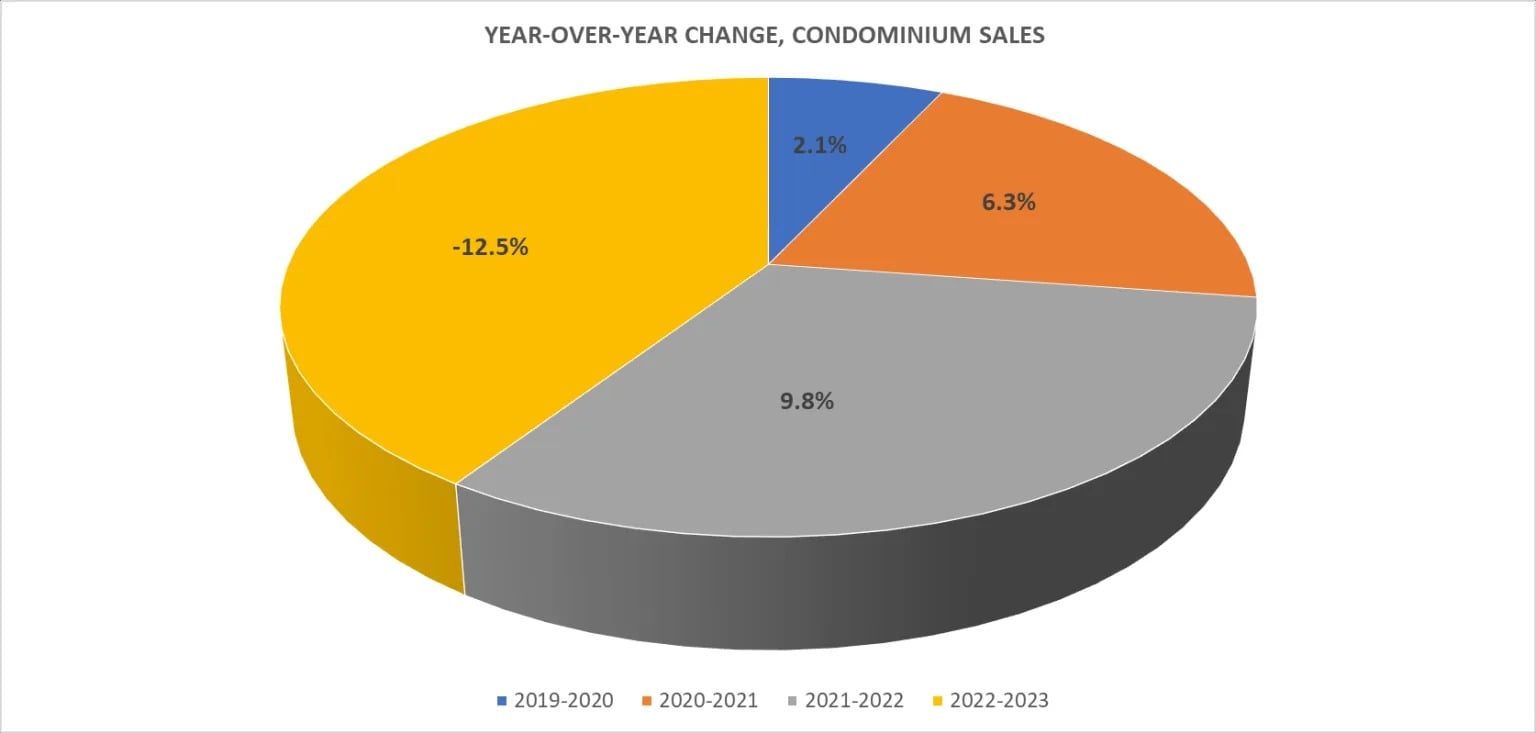
- Year-Over-Year Changes to Detached, Semi-Detached, Attached, and Condominium Average Sales From 2019-2023
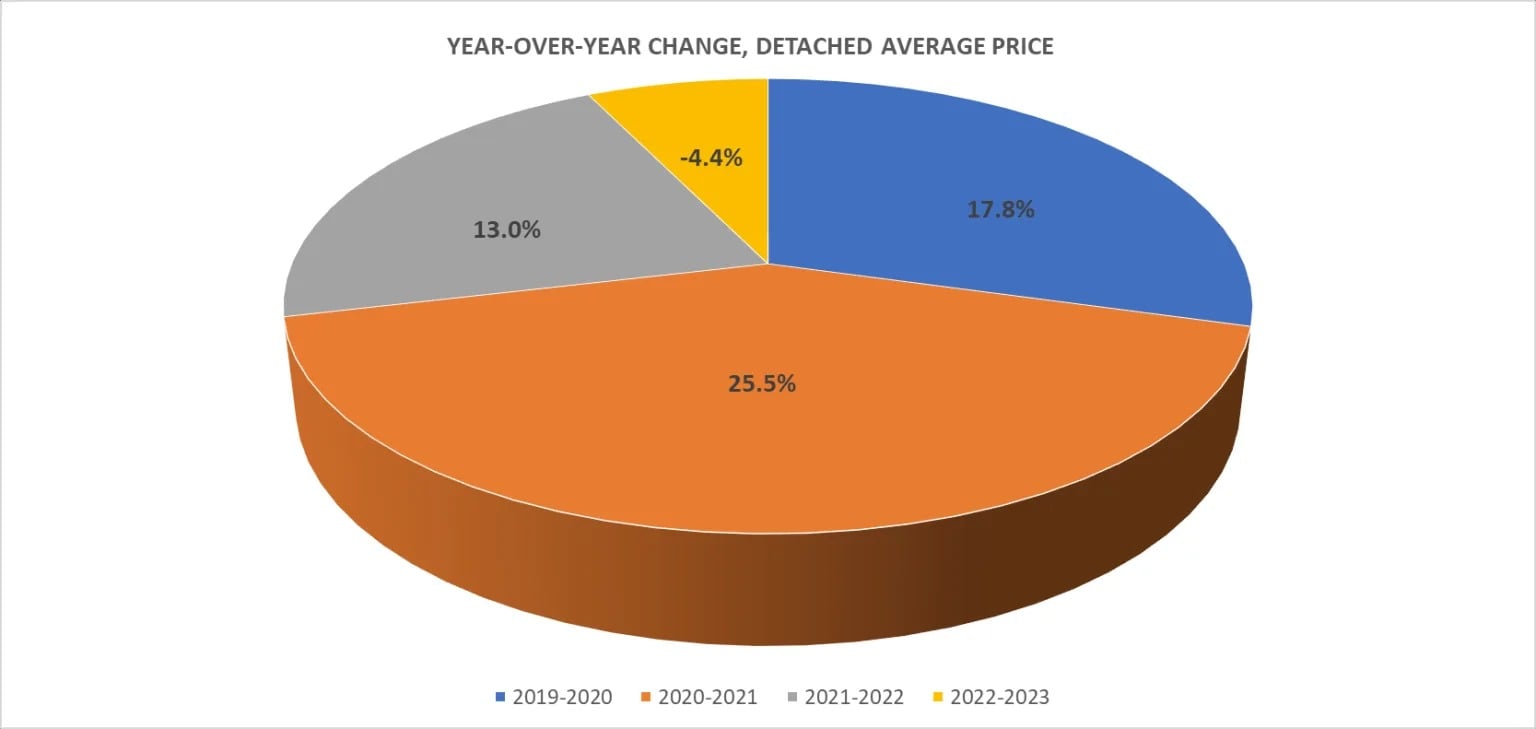
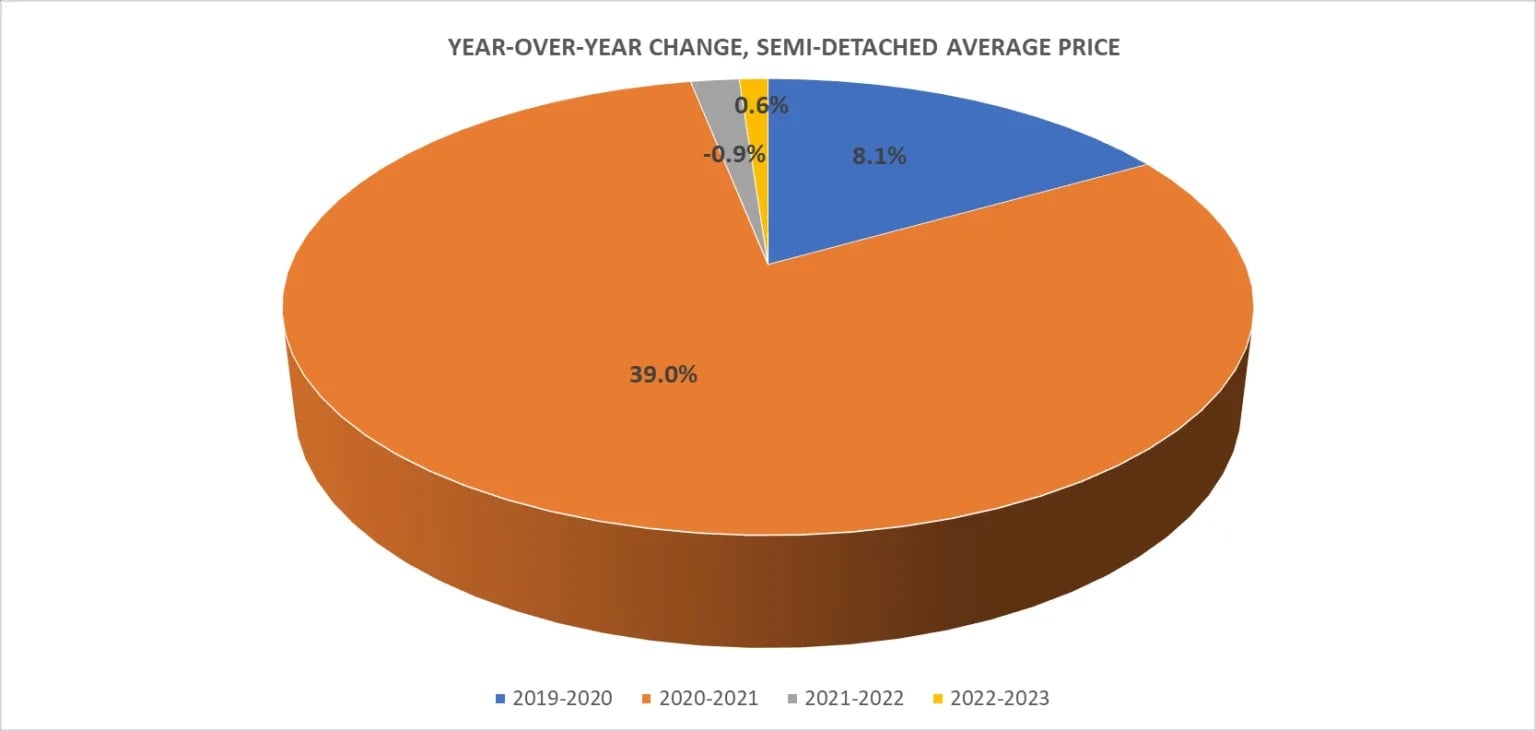
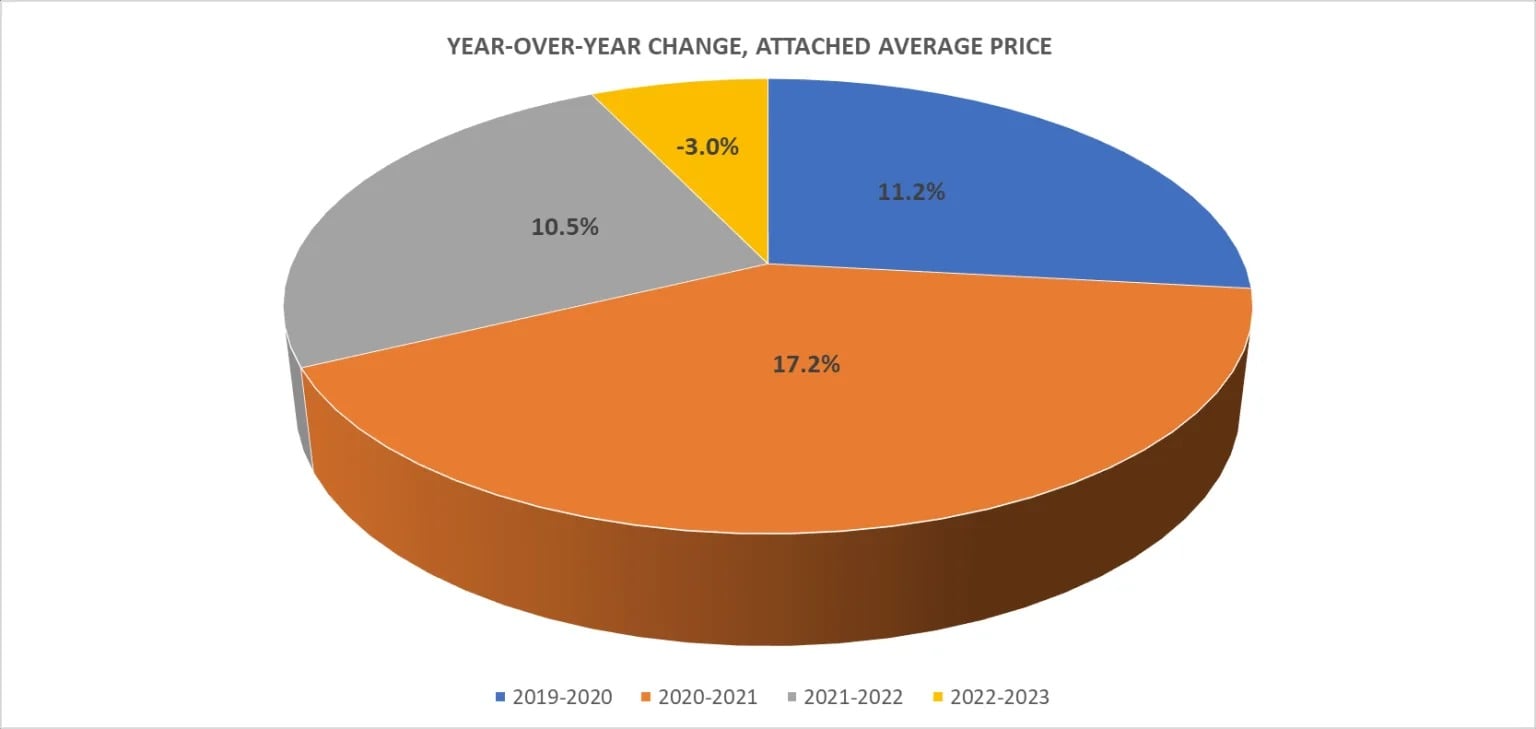
- Year-Over-Year Changes to Detached, Semi-Detached, Attached, and Condominium Average Sale Prices From 2019-2023
Average Sale Prices
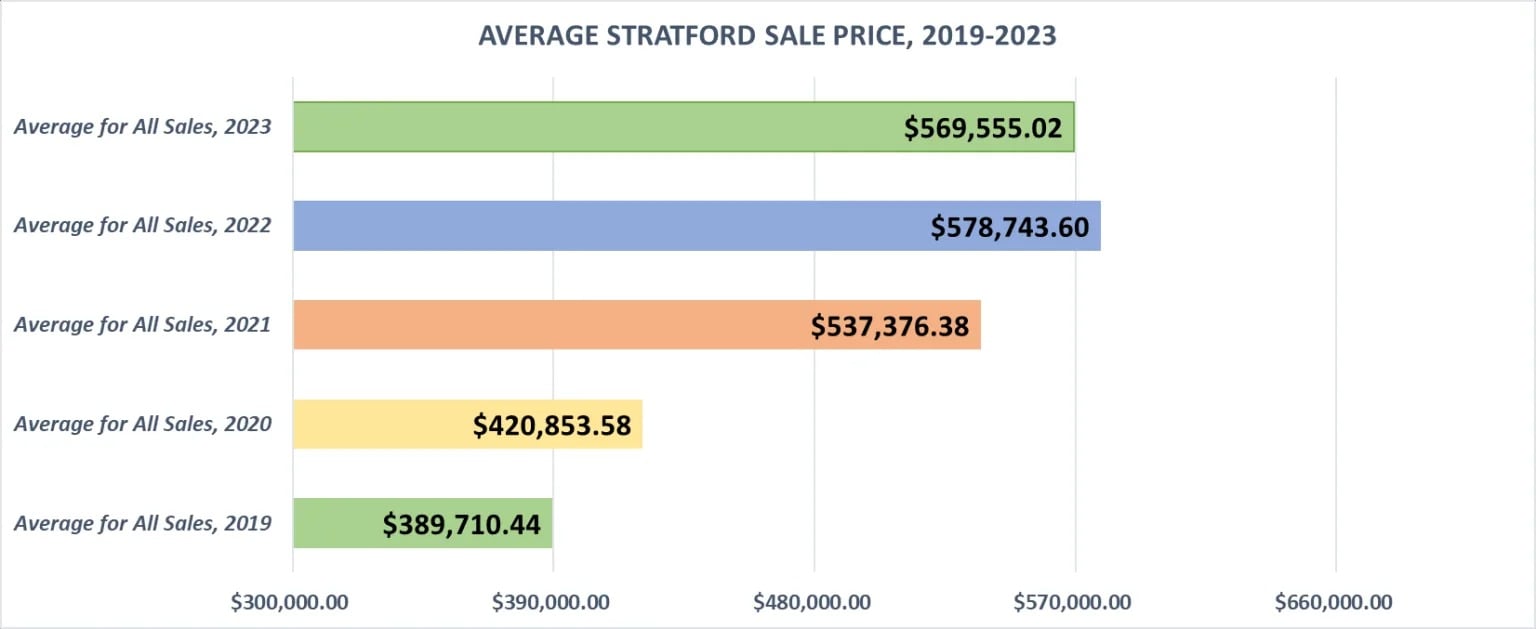
Contrary to the apprehension conveyed in various news reports regarding the real estate market’s performance in 2023, Stratford demonstrated resilience. Despite experiencing some price fluctuations, the overall average price in Stratford experienced only a slight decline of -2% compared to 2022.
The average sale price of detached homes decreased by -4.0%, while attached home prices saw a decline of -3.0%. Conversely, condominium prices exhibited growth, increasing by +2.0%.
A deeper analysis of the market over a 24-month period, comparing prices from 2021 to 2023, paints an even more positive picture. During this timeframe, properties in Stratford saw an average price increase of +6%. Specifically, detached home prices rose by +8.0%, semi-detached home prices remained stable, attached home prices increased by +7.0%, and condominium prices reported the highest average price increase of +9.0%.
Average Sale Prices (2023):
- Detached Home: $708,172
- Semi-Detached Home: $512,883
- Townhouse: $533,035
- Condominium: $524,129
AVERAGE SALE PRICE, DETACHED HOMES STRATFORD 2019-2023
| Month | Sale Price, Average 2019 | Sale Price, Average 2020 | Sale Price, Average 2021 | Sale Price, Average 2022 | Sale Price, Average 2023 |
| Jan | $345,535.00 | $417,105.00 | $531,302.00 | $790,159.00 | $609,836.00 |
| Feb | $435,598.00 | $579,948.00 | $566,192.00 | $815,063.00 | $628,312.00 |
| Mar | $396,694.00 | $430,444.00 | $607,904.00 | $872,459.00 | $748,504.00 |
| Apr | $417,165.00 | $423,905.00 | $642,596.00 | $858,414.00 | $701,995.00 |
| May | $490,862.00 | $580,703.00 | $684,024.00 | $830,243.00 | $769,732.00 |
| Jun | $458,039.00 | $494,934.00 | $640,551.00 | $707,213.00 | $801,647.00 |
| Jul | $438,079.00 | $501,854.00 | $644,799.00 | $658,235.00 | $731,596.00 |
| Aug | $476,319.00 | $525,049.00 | $675,486.00 | $750,606.00 | $726,369.00 |
| Sep | $451,511.00 | $560,872.00 | $646,922.00 | $651,889.00 | $844,940.00 |
| Oct | $486,737.00 | $634,181.00 | $769,945.00 | $607,698.00 | $645,115.00 |
| Nov | $411,209.00 | $576,175.00 | $685,355.00 | $681,622.00 | $608,441.00 |
| Dec | $511,302.00 | $542,656.00 | $768,885.00 | $665,790.00 | $681,583.00 |
| Year-Average | $443,254.00 | $522,318.00 | $655,330.00 | $740,782.00 | $708,172.00 |
AVERAGE SALE PRICE, SEMI-DETACHED HOMES STRATFORD 2019-2023
| Month | Sale Price, Average 2019 | Sale Price, Average 2020 | Sale Price, Average 2021 | Sale Price, Average 2022 | Sale Price, Average 2023 |
| Jan | N/A | $347,500.00 | $454,767.00 | $595,767.00 | $512,250.00 |
| Feb | $356,833.00 | $341,259.00 | $549,333.00 | $671,200.00 | $615,500.00 |
| Mar | $322,625.00 | $360,950.00 | $561,138.00 | $661,333.00 | $570,600.00 |
| Apr | $367,500.00 | $320,000.00 | $524,933.00 | $674,183.00 | $566,250.00 |
| May | $379,870.00 | $407,777.00 | $560,495.00 | $568,739.00 | $591,778.00 |
| Jun | $392,486.00 | $409,970.00 | $534,615.00 | $533,500.00 | $576,136.00 |
| Jul | $342,125.00 | $416,480.00 | $535,559.00 | $558,591.00 | $610,500.00 |
| Aug | $382,387.00 | $419,042.00 | $541,873.00 | $420,000.00 | $518,333.00 |
| Sep | $371,689.00 | $425,000.00 | $532,500.00 | $513,260.00 | $547,000.00 |
| Oct | $362,743.00 | $447,025.00 | $558,650.00 | $540,750.00 | $532,500.00 |
| Nov | $387,000.00 | $436,500.00 | $679,975.00 | $574,000.00 | $527,000.00 |
| Dec | $445,000.00 | $460,783.00 | $599,500.00 | $405,000.00 | $499,000.00 |
| Year-Average | $342,521.00 | $370,398.00 | $514,880.00 | $510,046.00 | $512,883.00 |
AVERAGE SALE PRICE, ATTACHED (TOWNHOMES) STRATFORD 2019-2023
| Month | Sale Price, Average 2019 | Sale Price, Average 2020 | Sale Price, Average 2021 | Sale Price, Average 2022 | Sale Price, Average 2023 |
| Jan | $403,450.00 | $539,324.00 | $297,450.00 | $498,750.00 | $546,650.00 |
| Feb | $335,760.00 | $443,518.00 | $563,900.00 | $557,875.00 | $533,333.00 |
| Mar | $420,400.00 | $464,923.00 | $441,397.00 | $540,247.00 | $465,063.00 |
| Apr | $425,000.00 | $328,500.00 | $467,191.00 | $556,067.00 | $484,500.00 |
| May | $320,771.00 | $415,000.00 | $508,750.00 | $584,373.00 | $568,886.00 |
| Jun | $403,412.00 | $386,071.00 | $541,200.00 | $545,983.00 | $558,140.00 |
| Jul | $396,900.00 | $376,175.00 | $505,778.00 | $774,575.00 | $492,910.00 |
| Aug | $389,064.00 | $451,689.00 | $464,700.00 | $551,188.00 | $646,780.00 |
| Sep | $449,000.00 | $388,289.00 | $476,571.00 | $514,144.00 | $485,500.00 |
| Oct | $340,450.00 | $438,642.00 | $523,129.00 | $494,750.00 | $538,771.00 |
| Nov | $326,317.00 | $416,840.00 | $569,000.00 | $464,150.00 | $444,950.00 |
| Dec | $367,000.00 | $441,585.00 | $607,500.00 | $510,850.00 | $630,940.00 |
| Year-Average | $381,460.00 | $424,213.00 | $497,213.00 | $549,412.00 | $533,035.00 |
AVERAGE SALE PRICE, CONDOMINIUMS STRATFORD 2019-2023
| Month | Sale Price, Average 2019 | Sale Price, Average 2020 | Sale Price, Average 2021 | Sale Price, Average 2022 | Sale Price, Average 2023 |
| Jan | $403,450.00 | $539,324.00 | $297,450.00 | $498,750.00 | $501,250.00 |
| Feb | $336,567.00 | $442,438.00 | $575,000.00 | $477,167.00 | $405,000.00 |
| Mar | $438,000.00 | $464,923.00 | $393,590.00 | $521,700.00 | $485,083.00 |
| Apr | $437,000.00 | $247,000.00 | $458,375.00 | $512,084.00 | $484,500.00 |
| May | $365,057.00 | N/A | $508,750.00 | $563,122.00 | $538,883.00 |
| Jun | $399,894.00 | $305,633.00 | $519,250.00 | $441,667.00 | $564,777.00 |
| Jul | $422,680.00 | $376,175.00 | $482,571.00 | $774,575.00 | $510,850.00 |
| Aug | $401,538.00 | $444,500.00 | $355,725.00 | $569,929.00 | $682,300.00 |
| Sep | $557,333.00 | $368,267.00 | $452,857.00 | $440,667.00 | $471,800.00 |
| Oct | $250,000.00 | $408,922.00 | $564,900.00 | $553,500.00 | $545,233.00 |
| Nov | $320,750.00 | $394,745.00 | $569,000.00 | $436,633.00 | $444,950.00 |
| Dec | $367,000.00 | $405,877.00 | $607,500.00 | $387,000.00 | $654,925.00 |
| Year-Average | $391,605.00 | $366,483.00 | $482,080.00 | $514,732.00 | $524,129.00 |
AVERAGE SALE PRICE, ALL STRATFORD 2019-2023
Total Sales Volume
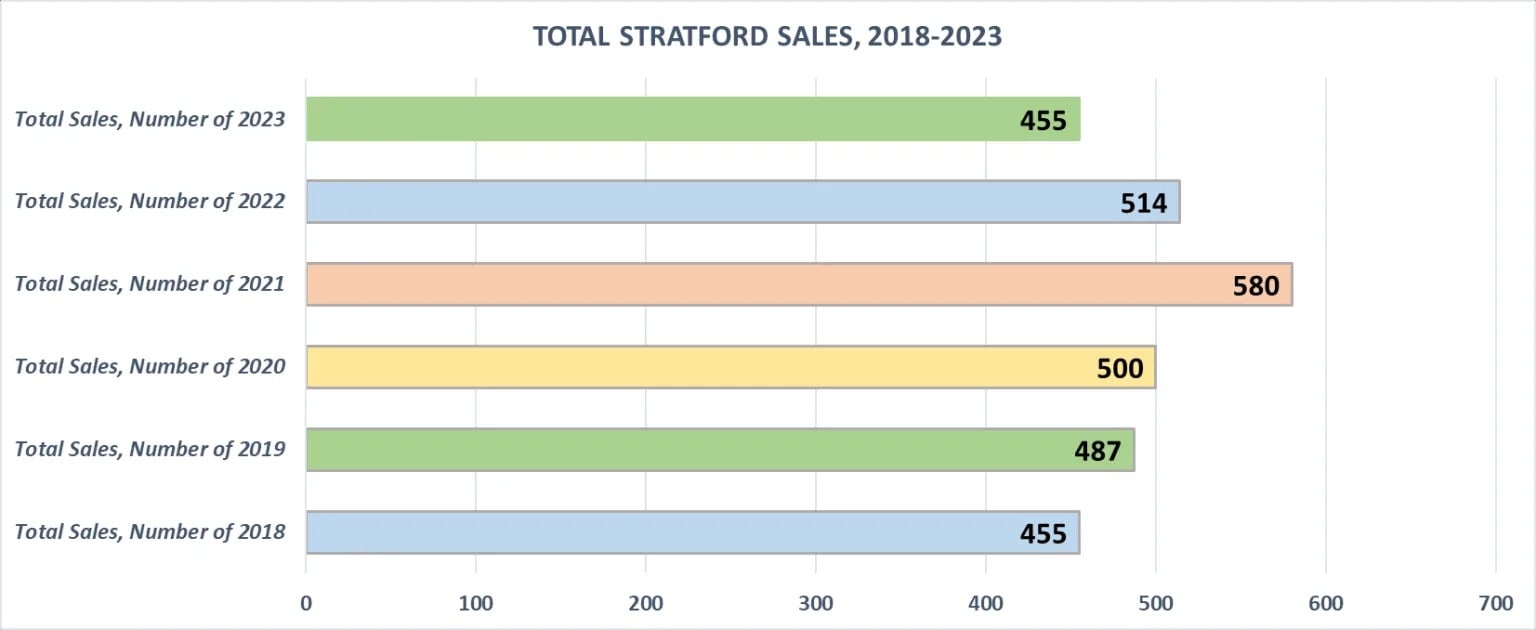
Stratford experienced a decline of -11.0% in the total number of sales compared to 2022, with 455 sales recorded in 2023 versus 514 in 2022. The market peaked in 2021 with 580 sales reported, reflecting a decline of -21.6%.
Total Sales (2023):
- Detached Home: 282
- Semi-Detached Home: 50
- Townhouse: 74
- Condominium: 49
DETACHED HOMES SALES IN STRATFORD, 2019-2023
| Month | Sales, Number of 2019 | Sales, Number of 2020 | Sales, Number of 2021 | Sales, Number of 2022 | Sales, Number of 2023 |
| Jan | 13 | 15 | 4 | 15 | 15 |
| Feb | 18 | 24 | 18 | 25 | 13 |
| Mar | 19 | 23 | 48 | 34 | 18 |
| Apr | 38 | 10 | 43 | 38 | 28 |
| May | 25 | 24 | 49 | 30 | 34 |
| Jun | 28 | 35 | 34 | 27 | 34 |
| Jul | 39 | 48 | 34 | 27 | 29 |
| Aug | 31 | 42 | 38 | 32 | 24 |
| Sep | 33 | 25 | 32 | 28 | 26 |
| Oct | 34 | 28 | 31 | 24 | 26 |
| Nov | 22 | 26 | 27 | 18 | 17 |
| Dec | 20 | 14 | 12 | 10 | 18 |
| Total Sales | 320 | 314 | 370 | 308 | 282 |
SEMI–DETACHED HOMES SALES IN STRATFORD, 2019-2023
| Month | Sales, Number of 2019 | Sales, Number of 2020 | Sales, Number of 2021 | Sales, Number of 2022 | Sales, Number of 2023 |
| Jan | 3 | 3 | 3 | 2 | |
| Feb | 3 | 7 | 3 | 5 | 2 |
| Mar | 2 | 4 | 8 | 6 | 4 |
| Apr | 3 | 1 | 8 | 6 | 4 |
| May | 9 | 1 | 18 | 8 | 9 |
| Jun | 7 | 4 | 13 | 6 | 11 |
| Jul | 4 | 8 | 11 | 11 | 4 |
| Aug | 9 | 8 | 11 | 1 | 3 |
| Sep | 9 | 6 | 4 | 5 | 3 |
| Oct | 7 | 4 | 7 | 4 | 2 |
| Nov | 1 | 10 | 4 | 3 | 3 |
| Dec | 1 | 3 | 2 | 1 | 3 |
| Total Sales | 55 | 59 | 92 | 59 | 50 |
ATTACHED (TOWNHOMES) SALES IN STRATFORD, 2019-2023
| Month | Sales, Number of 2019 | Sales, Number of 2020 | Sales, Number of 2021 | Sales, Number of 2022 | Sales, Number of 2023 |
| Jan | 4 | 2 | 2 | 4 | 6 |
| Feb | 5 | 7 | 3 | 4 | 3 |
| Mar | 5 | 5 | 10 | 15 | 4 |
| Apr | 6 | 2 | 7 | 10 | 2 |
| May | 7 | 1 | 4 | 11 | 10 |
| Jun | 6 | 7 | 3 | 6 | 15 |
| Jul | 6 | 4 | 9 | 6 | 7 |
| Aug | 12 | 9 | 7 | 8 | 5 |
| Sep | 3 | 9 | 10 | 9 | 8 |
| Oct | 2 | 12 | 7 | 8 | 7 |
| Nov | 6 | 15 | 3 | 6 | 2 |
| Dec | 3 | 6 | 2 | 4 | 5 |
| Total Sales | 65 | 79 | 67 | 91 | 74 |
CONDOMINUM SALES IN STRATFORD, 2019-2023
| Month | Sales, Number of 2019 | Sales, Number of 2020 | Sales, Number of 2021 | Sales, Number of 2022 | Sales, Number of 2023 |
| Jan | 4 | 2 | 2 | 4 | 4 |
| Feb | 3 | 6 | 1 | 3 | 1 |
| Mar | 4 | 5 | 8 | 11 | 3 |
| Apr | 5 | 1 | 6 | 8 | 2 |
| May | 7 | N/A | 4 | 9 | 6 |
| Jun | 5 | 3 | 2 | 3 | 13 |
| Jul | 5 | 4 | 7 | 6 | 4 |
| Aug | 7 | 2 | 4 | 7 | 3 |
| Sep | 3 | 3 | 9 | 3 | 5 |
| Oct | 1 | 9 | 5 | 2 | 6 |
| Nov | 4 | 11 | 3 | 3 | 2 |
| Dec | 3 | 4 | 2 | 1 | 4 |
| Total Sales | 47 | 48 | 51 | 56 | 49 |
TOTAL STRATFORD SALES, 2019-2023
2023 Forecast
Looking ahead to 2023, we anticipate a higher volume of sales in the residential market in Stratford and its surrounding areas. There are compelling reasons to support this forecast, notably the Bank of Canada’s decision to maintain its current rate for the past four rate announcements.
Other Factors Include
- Inflation down to 3.1% and projected to hover around 3.0%
- We anticipate The Bank of Canada to announce a .25% rate cut expected on the scheduled June 5th interest rate announcement date,
- The sustained stability in interest rates has bolstered confidence among buyers and sellers, encouraging them to proceed with transactions in the coming months, given the overall favorable economic outlook.
All statistics gathered independently from ITSO (INFORMATION TECHNOLOGY SYSTEMS ONTARIO)®.
This publication is not to be copied or duplicated without the express written permission of Roxanne Finn.
This publication is not intended to solicit buyers or sellers currently under contract with a brokerage.
Check out this article next