
The 4th Quarter Edition (October-December) of our Kitchener, Waterloo, and Cambridge (KW Region) Detached Real Estate Market Report will examine:
- Number of Sales
- Average Sale Price
- Median Sale Price
- Price Per Square Foot ($/SQFT)
- Percentage Paid Over Asking Price
- Days on Market
Summary
The Kitchener-Waterloo (KW Region) real estate market has experienced significant changes in detached home sales between the fourth quarter of 2023 and the fourth quarter of 2024, reflecting varying trends across the region’s key cities. In Kitchener, the average sale price of detached homes saw a modest yet steady growth of +4.6%, suggesting resilient demand and a potential increase in buyer confidence. Conversely, Cambridge experienced a slight decline of -3.2% in detached home prices, indicating possible market adjustments, changing buyer preferences, or increased competition from neighboring areas. Meanwhile, Waterloo recorded a modest price increase of +2.9%, highlighting continued interest in the city’s detached housing market and reinforcing its appeal to both homebuyers and investors. These shifts provide valuable insights into localized market dynamics, influenced by factors such as affordability, inventory levels, and broader economic conditions that impact property values in the KW region.
Interestingly, the pace at which detached homes are selling has remained relatively consistent compared to the same period last year, suggesting stable demand across the KW Region real estate market. Currently, the average time on the market for detached homes is 17 days in Kitchener, 21 days in Waterloo, and 17 days in Cambridge. In comparison, last year’s figures were slightly lower, with Kitchener averaging 16 days, Waterloo 17 days, and Cambridge 15 days. These minor fluctuations indicate that while market conditions have shifted in terms of pricing, buyer activity and competition levels have remained steady, preventing significant changes in selling speed. Factors such as sustained buyer interest, balanced inventory levels, and strategic pricing may have contributed to this consistency in market performance across the region.
Overall, the Kitchener-Waterloo real estate market continues to demonstrate resilience and stability despite fluctuations in detached home prices. While price trends vary across Kitchener, Waterloo, and Cambridge, the relatively consistent pace of home sales suggests that demand remains strong and balanced. Buyers and sellers can take confidence in the market’s steady performance, supported by factors such as ongoing interest, strategic pricing, and manageable inventory levels. Moving forward, monitoring these trends will be crucial to identifying future opportunities and challenges within the KW real estate landscape.
Average Sale Prices (Q4 2024):
- Kitchener: $868,457
- Waterloo: $943,441
- Cambridge: $802,667
Total Sales (Q4 2024):
- Kitchener: 396
- Waterloo: 129
- Cambridge: 259
1- Year Trends
The analysis encompassed both monthly and quarterly data pertaining exclusively to detached homes in the Kitchener, Waterloo, and Cambridge areas. The quarterly graphs depict the average values for each quarter spanning from October 2023 to December 2024.
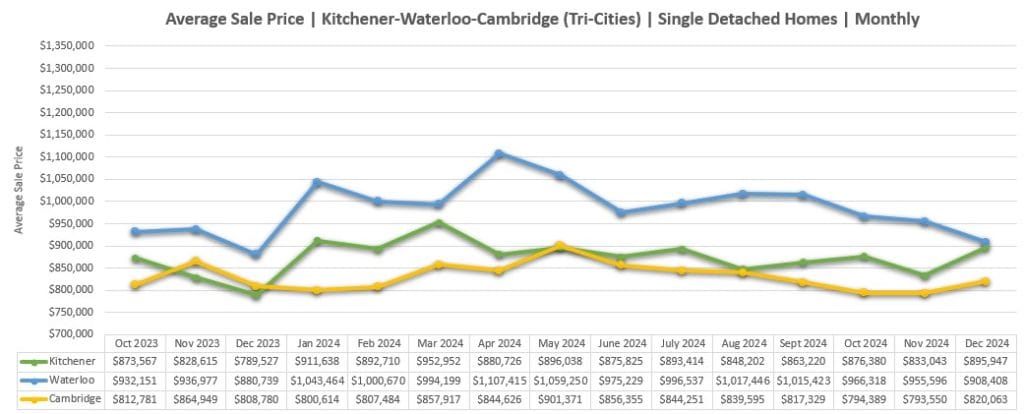
Average Sale Prices
Monthly
Quarterly
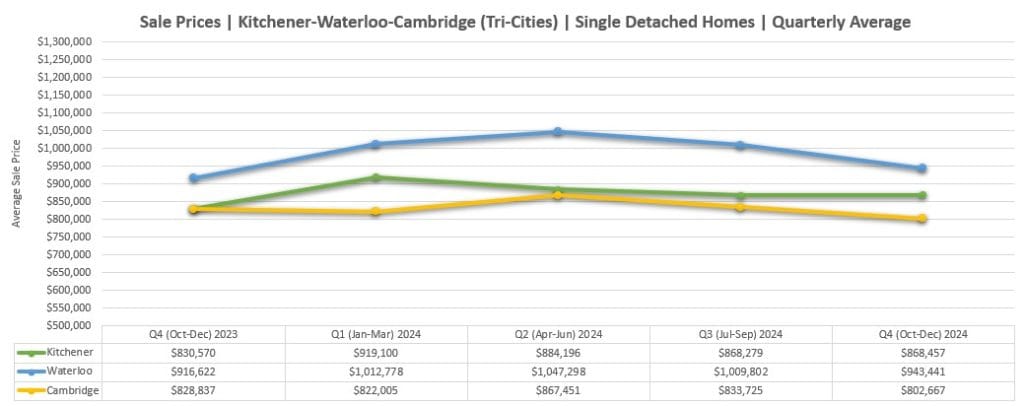
Fourth Quarter (October-December) year-over-year change from 2023 to 2024:
- Kitchener: Year-Over-Year increase of +4.6% in Q4 2024 vs 2023.
- Waterloo: Year-Over-Year increase of +2.9% in Q4 2024 vs 2023.
- Cambridge: Year-Over-Year decrease of -3.2% in Q4 2024 vs 2023.
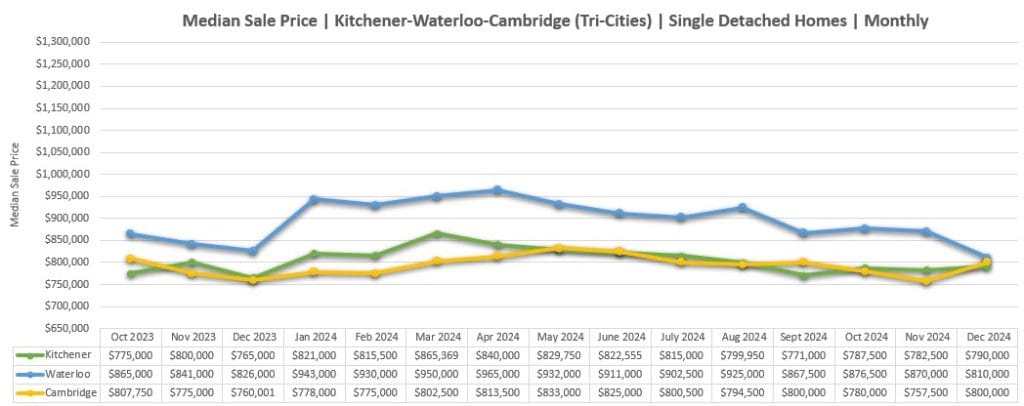
Median Sale Prices
Monthly
Quarterly
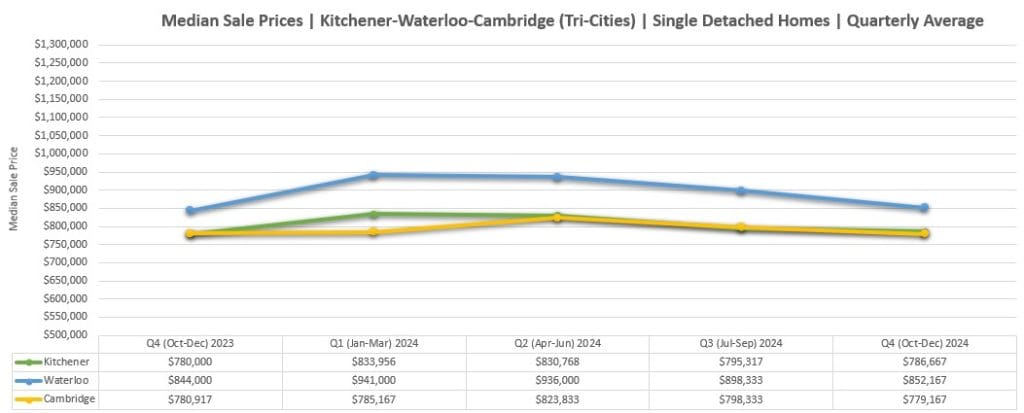
Fourth Quarter (October-December) year-over-year change from 2023 to 2024:
- Kitchener: Year-Over-Year increase of +0.9% in Q4 2024 vs 2023.
- Waterloo: Year-Over-Year increase of +1.0% in Q4 2024 vs 2023.
- Cambridge: Year-Over-Year decrease of -0.2% in Q4 2024 vs 2023.
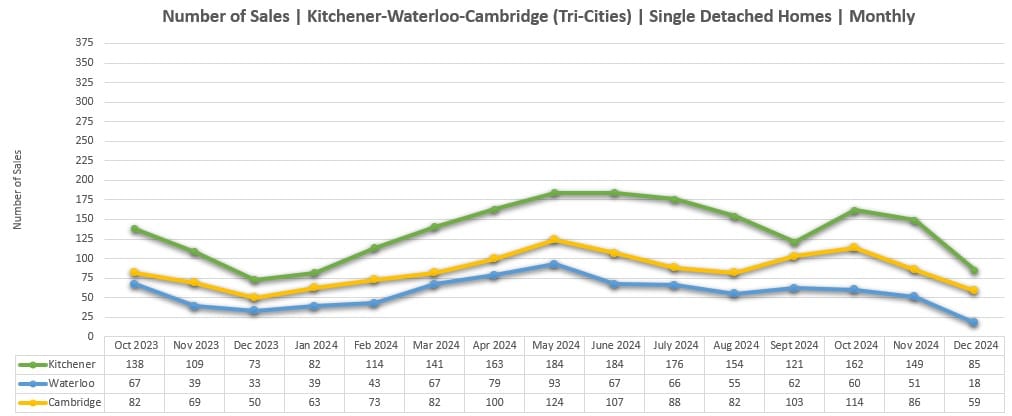
Number of Sales
Monthly
Quarterly
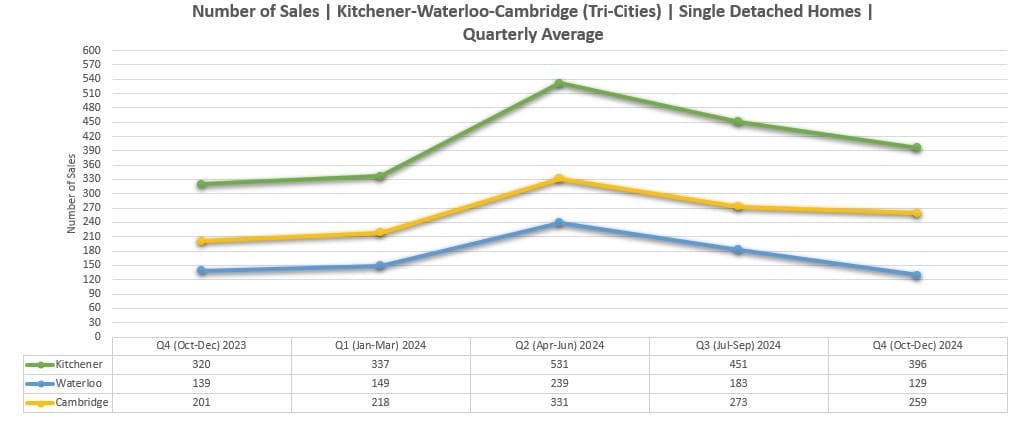
Fourth Quarter (October-December) year-over-year change from 2023 to 2024:
- Kitchener: Year-Over-Year increase of +23.8% in Q4 2024 vs 2023.
- Waterloo: Year-Over-Year decrease of -7.2% in Q4 2024 vs 2023.
- Cambridge: Year-Over-Year increase of +28.9% in Q4 2024 vs 2023.
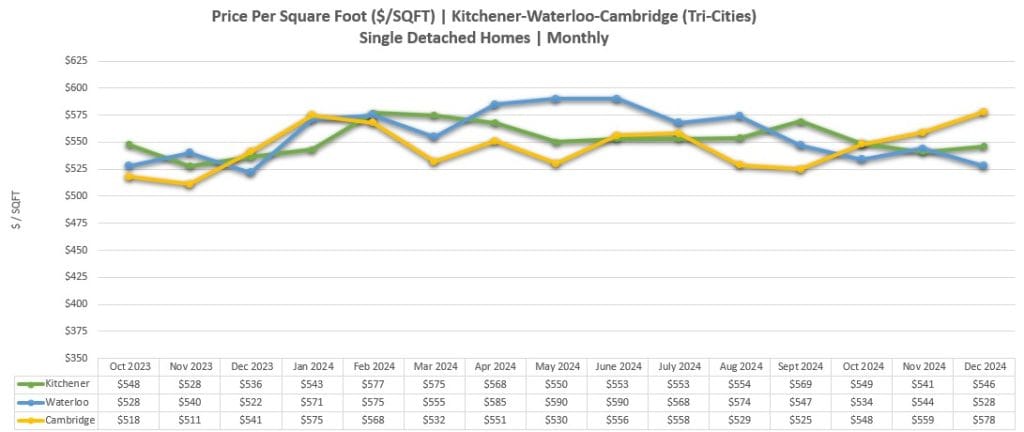
Price Per Square Foot ($/SQFT)
Monthly
Quarterly
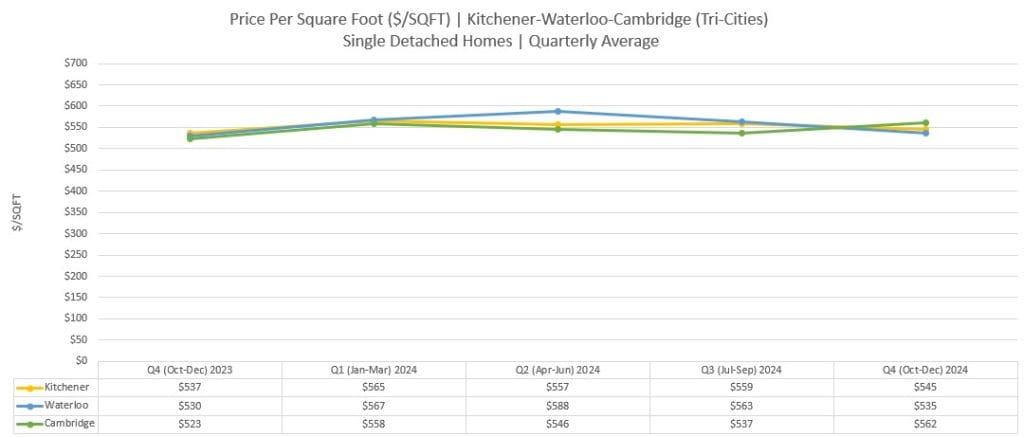
Fourth Quarter (October-December) year-over-year change from 2023 to 2024:
- Kitchener: Year-Over-Year increase of +1.5% in Q4 2024 vs 2023.
- Waterloo: Year-Over-Year increase of 1.0% in Q4 2024 vs 2023.
- Cambridge: Year-Over-Year increase of +7.3% in Q4 2024 vs 2023.
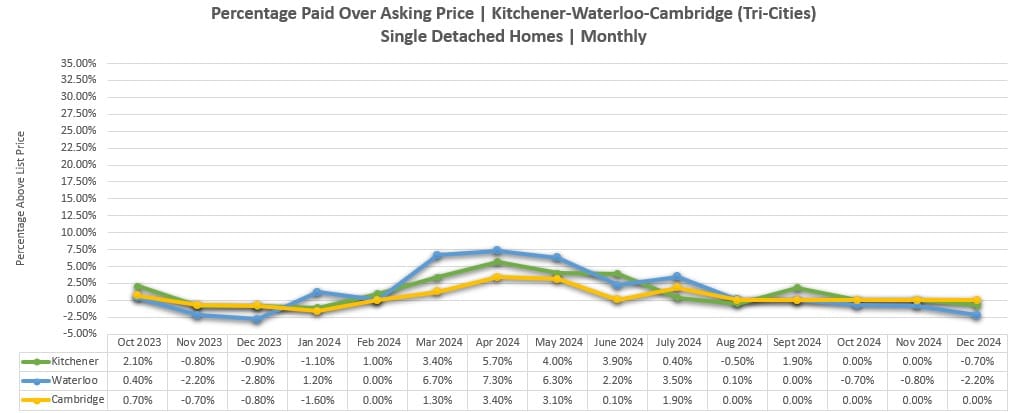
Percentage Sold Above Asking Price
Monthly
Quarterly
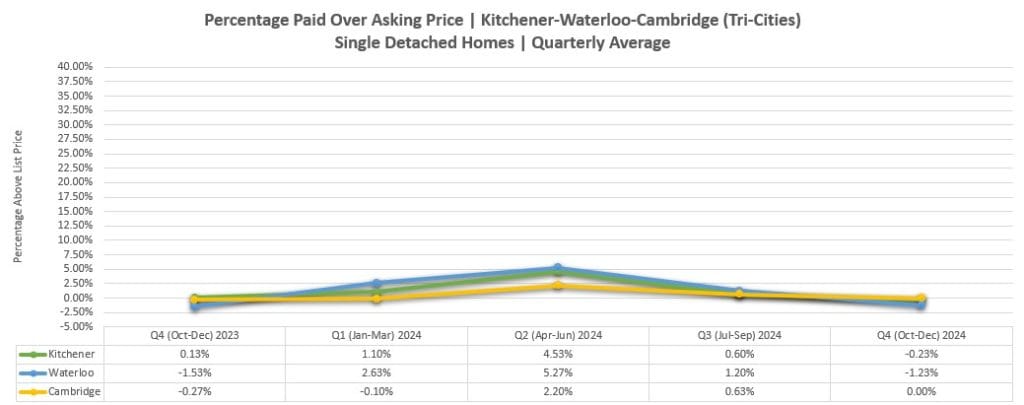
Fourth Quarter (October-December) year-over-year change from 2023 to 2024:
- Kitchener: In Q4 of 2023, buyers paid an average of 0.13% above the asking price. This year, the average discount paid by buyers has increased to 0.23% below the asking price, representing a 276.9% year-over-year decline.
- Waterloo: In Q4 of 2023, buyers paid an average of 1.53% below the asking price. This year, the average discount paid by buyers has decreased to 1.23% below the asking price, representing a 19.6% year-over-year decline.
- Cambridge: In Q4 of 2023, buyers paid, on average, 0.27% less than the asking price. However, in the same period this year, buyers offered the list price, without having to pay more or less than the asking price. This represents a 100.0% increase year-over-year in buyers paying the full asking price.
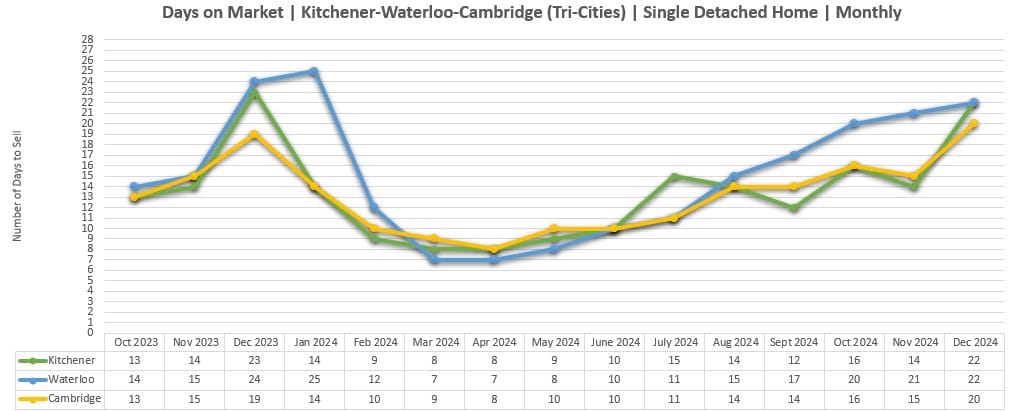
Days to Sell (Average)
Monthly
Quarterly
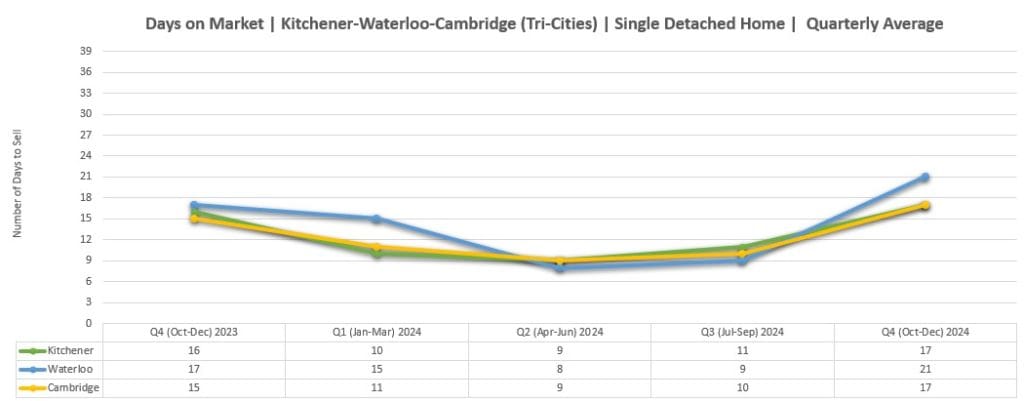
- Detached homes are selling on average in 17 days in Kitchener, which is a +6.3% increase compared to Q4 2023.
- In Waterloo, detached homes are selling on average in 21 days, reflecting a +23.5% increase from Q4 2023.
- In Cambridge, detached homes are selling on average in 17 days, representing a +13.3% increase from Q4 2023.

All statistics gathered independently from Huron Perth Association of REALTORS®.
This publication is not to be copied or duplicated without the express written permission of Roxanne Finn.
This publication is not intended to solicit buyers or sellers currently under contract with a brokerage.