The 3rd Quarter Edition (July-September) of our Kitchener, Waterloo, and Cambridge Detached Real Estate Market Report will examine:
- Number of Sales
- Average Sale Price
- Median Sale Price
- Price Per Square Foot ($/SQFT)
- Percentage Paid Over Asking Price
- Days on Market
Summary
The Kitchener-Waterloo (KW) real estate market has experienced notable shifts in detached home sales from Q3 of 2023 to Q3 of 2024. While Kitchener saw a modest decline in the average sale price of detached homes, with a decrease of -1.9%, and Cambridge remained relatively stable with a slight dip of -0.9%, Waterloo bucked the trend with a solid 5.4% increase in detached home prices. This highlights the resilience of the Waterloo market in comparison to its neighboring cities.
Interestingly, the speed at which detached homes are selling remains strong, much like last year. In both Waterloo and Cambridge, homes continue to sell swiftly, maintaining the same average days on the market: 9 days in Waterloo and 10 days in Cambridge. Kitchener saw only a slight increase in average time on market, from 9 days last year to 11 days this year, still a relatively fast pace.
The Q3 2024 market for detached homes in Kitchener-Waterloo-Cambridge reflects a shift towards more balanced conditions compared to the highly competitive market of last year. With homes selling closer to or at asking price, and consistent or improving prices in some areas like Waterloo, buyers are finding more opportunities to enter the market without facing the intense bidding wars seen in 2023. However, the quick turnover of homes highlights that demand remains strong. As we move into the next quarter, it will be important to monitor whether these trends continue or if further adjustments in price and buyer behavior emerge.
Average Sale Prices (Q3 2024):
- Kitchener: $868,279
- Waterloo: $1,009,802
- Cambridge: $833,725
Total Sales (Q3 2024):
- Kitchener: 451
- Waterloo: 183
- Cambridge: 273
1- Year Trends
The analysis encompassed both monthly and quarterly data pertaining exclusively to detached homes in the Kitchener, Waterloo, and Cambridge areas. The quarterly graphs depict the average values for each quarter spanning from July 2023 to September 2024.
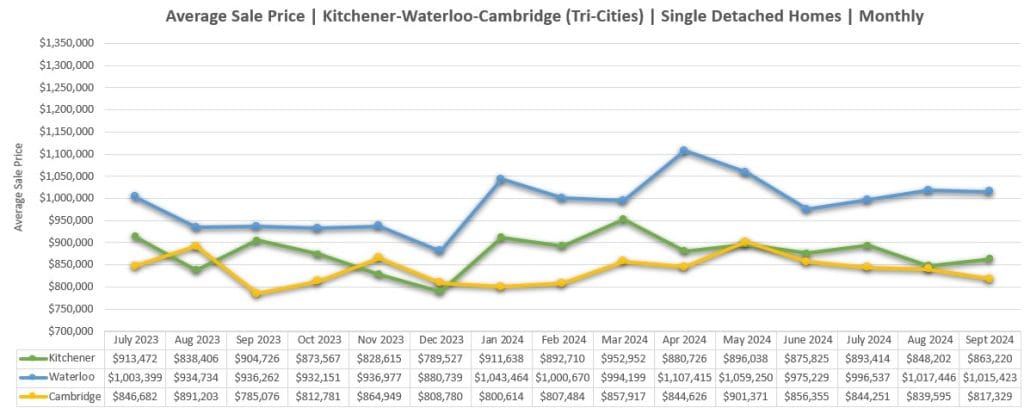
Average Sale Prices
Monthly
Quarterly
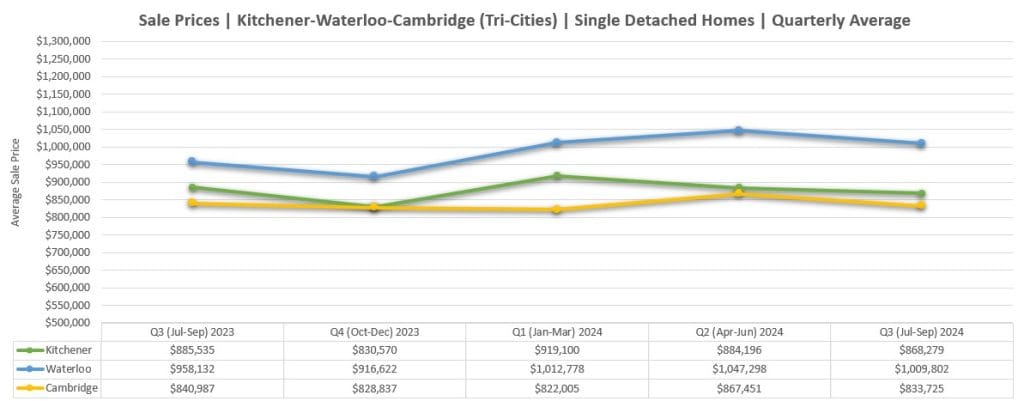
Third Quarter (July-September) year-over-year change from 2023 to 2024:
- Kitchener: Year-Over-Year decrease of -1.9% in Q3 2024 vs 2023.
- Waterloo: Year-Over-Year increase of +5.4% in Q3 2024 vs 2023.
- Cambridge: Year-Over-Year decrease of -0.9% in Q3 2024 vs 2023.
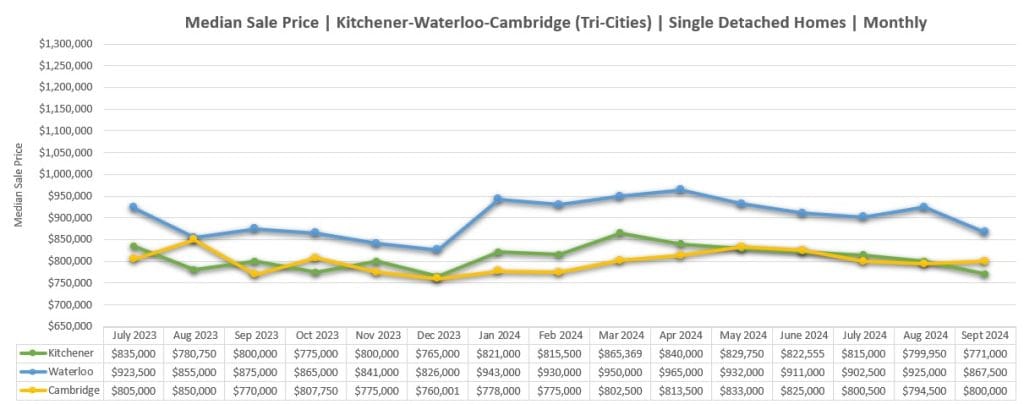
Median Sale Prices
Monthly
Quarterly
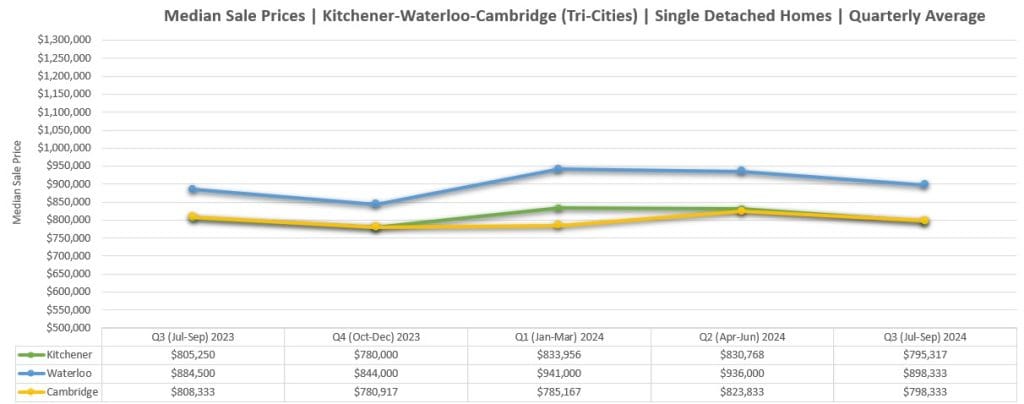
Third Quarter (July-September) year-over-year change from 2023 to 2024:
- Kitchener: Year-Over-Year decrease of -1.2% in Q3 2024 vs 2023.
- Waterloo: Year-Over-Year increase of +1.6% in Q3 2024 vs 2023.
- Cambridge: Year-Over-Year decrease of -1.2% in Q3 2024 vs 2023.
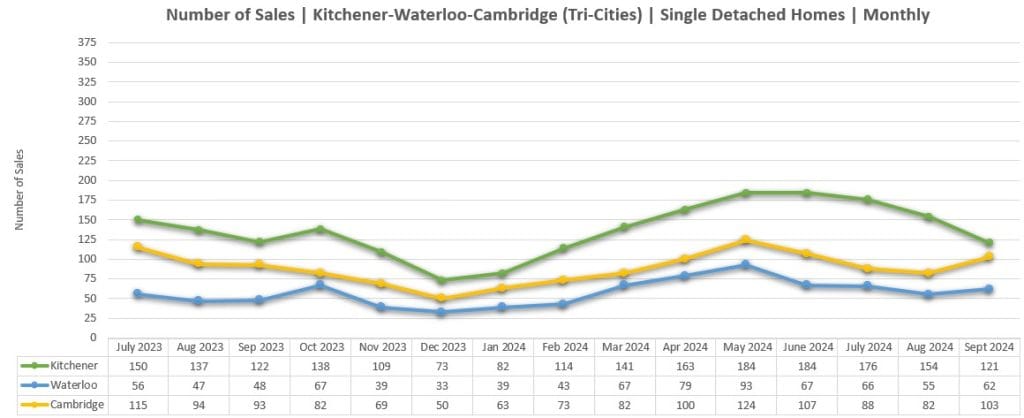
Number of Sales
Monthly
Quarterly
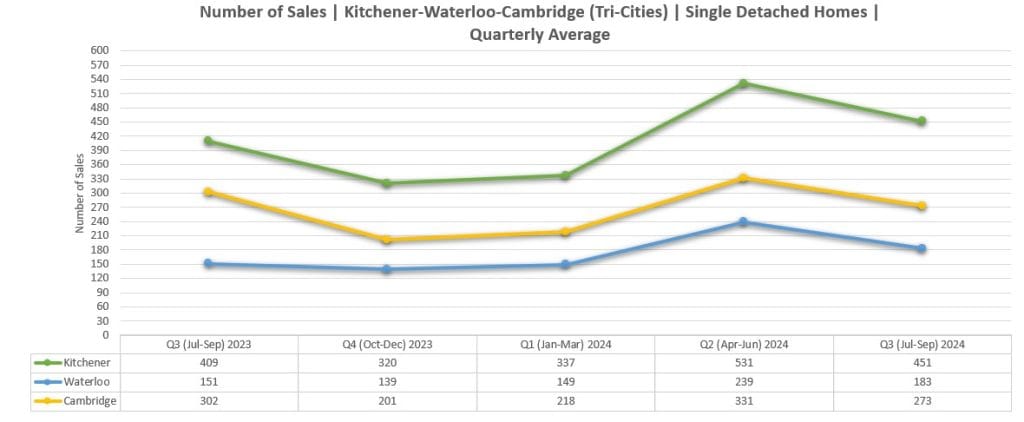
Third Quarter (April-June) year-over-year change from 2023 to 2024:
- Kitchener: Year-Over-Year increase of +10.3% in Q3 2024 vs 2023.
- Waterloo: Year-Over-Year increase of +21.2% in Q3 2024 vs 2023.
- Cambridge: Year-Over-Year decrease of -9.6% in Q3 2024 vs 2023.
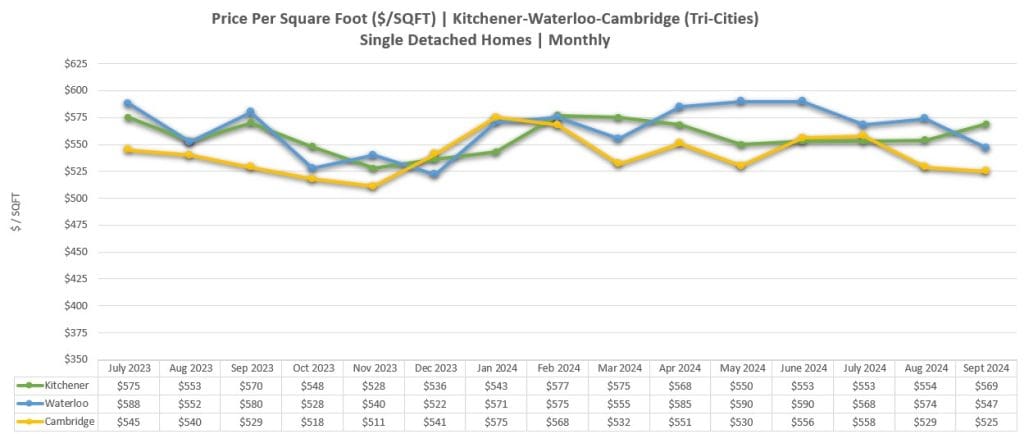
Price Per Square Foot ($/SQFT)
Monthly
Quarterly
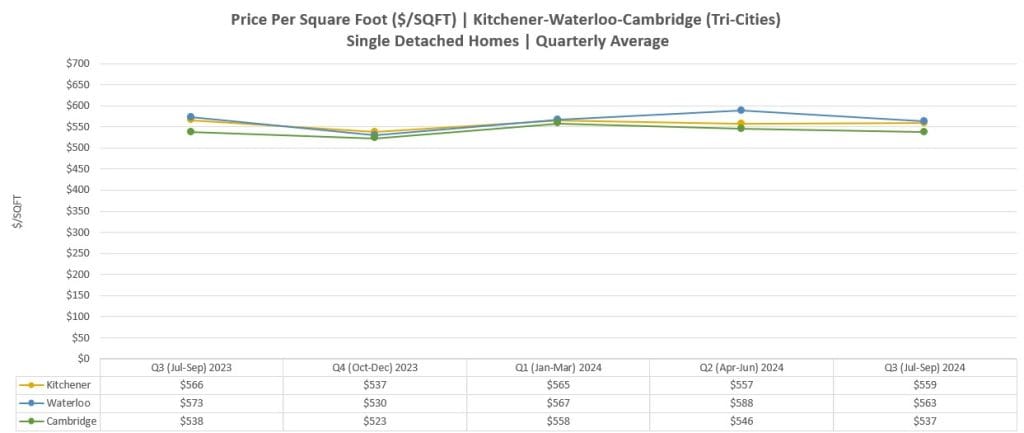
Third Quarter (July-September) year-over-year change from 2023 to 2024:
- Kitchener: Year-Over-Year decrease of -1.3% in Q3 2024 vs 2023.
- Waterloo: Year-Over-Year decrease of -1.7% in Q3 2024 vs 2023.
- Cambridge: Year-Over-Year decrease of -0.1% in Q3 2024 vs 2023.
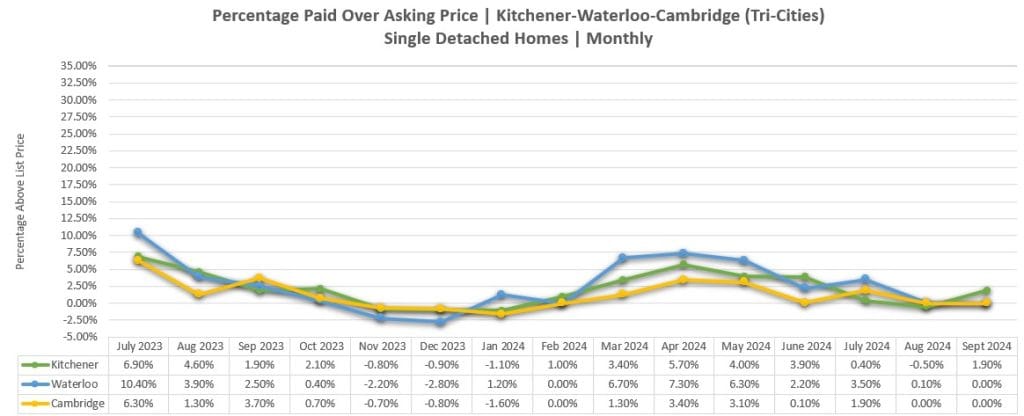
Percentage Sold Above Asking Price
Monthly
Quarterly
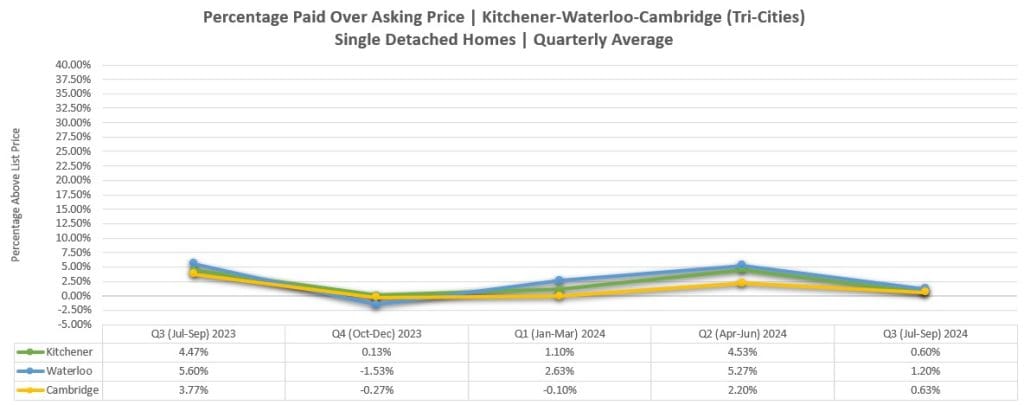
Third Quarter (July-September) year-over-year change from 2023 to 2024:
- Kitchener: In Q3 of 2023, buyers paid an average of +4.47% above the asking price. This year, the average premium paid by buyers has decreased to +1.20%, representing a -86.6% year-over-year decline.
- Waterloo: In Q3 of 2023, buyers paid an average of +5.60% above the asking price. This year, the average premium paid by buyers has decreased to +1.20 above the asking price, representing a -78.6% year-over-year decline.
- Cambridge: In Q3 of 2023, buyers paid on average +3.77% more than the asking price, while this year, we witnessed buyers paying 0.63% more than the asking price. This represents a -83.2% decline year-over-year.
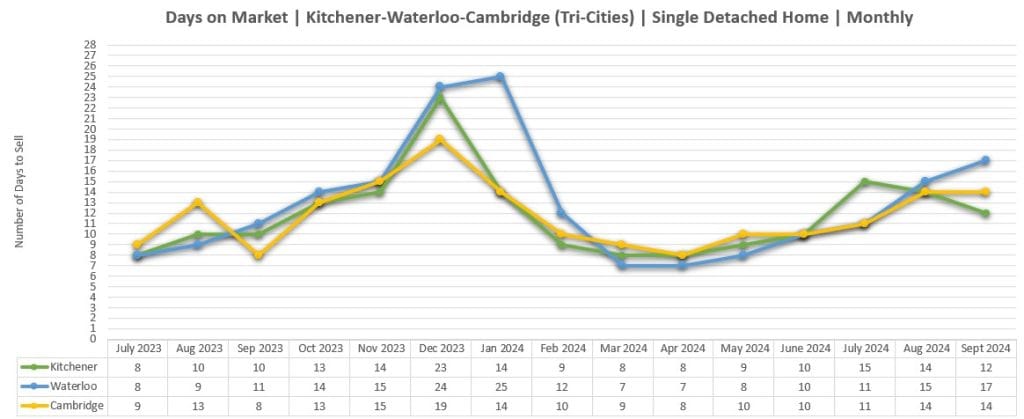
Days to Sell (Average)
Monthly
Quarterly
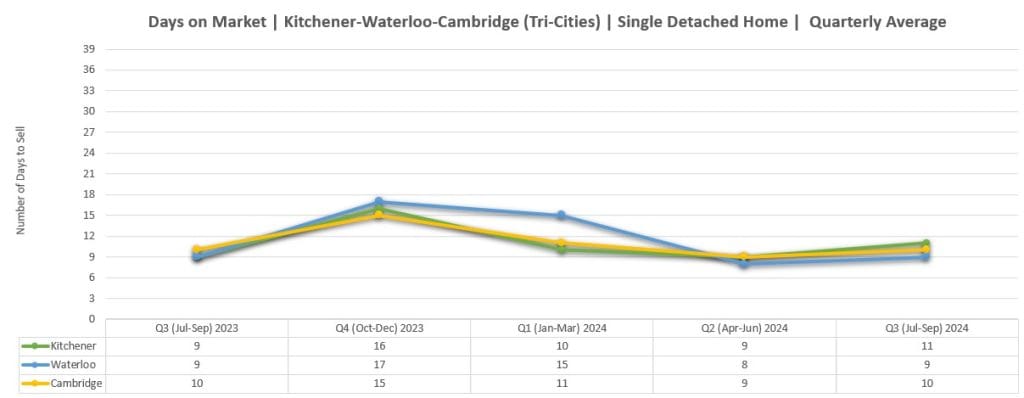
- Detached homes are selling on an average of 11 days in Kitchener. This timeframe is up by +22.2% from Q3 2023.
- Detached homes are selling on an average of 9 days in Waterloo. This timeframe has remained consistent with Q3 2023 showing the same average.
- Detached homes are selling on an average of 10 days in Cambridge. This timeframe has remained consistent with Q3 2023 showing the same average.

All statistics gathered independently from Huron Perth Association of REALTORS®.
This publication is not to be copied or duplicated without the express written permission of Roxanne Finn.
This publication is not intended to solicit buyers or sellers currently under contract with a brokerage.