
The 3rd Quarter Edition (July-September) of our Stratford Real Estate Market Report will examine:
- Number of Sales
- Average Sale Price
- Price Per Square Foot ($/SQFT)
- Days on Market
- List Price to Sale Price Ratio
Summary
The Stratford real estate market has shown mixed results over the past year, reflecting various trends across different property types. Detached home prices have decreased by -4.8%, while townhome prices have risen slightly by +6.9%. Semi-detached homes have seen the most significant price increase, up by +8.1%, whereas condominiums have experienced the largest price drop, with a decrease of -10.0% compared to Q3 of 2023.
Despite these price changes, detached homes are selling faster, with the average days on the market dropping by -18.2%, now at 27 days. Townhomes, however, are taking longer to sell, with the time on market increasing by +54.5%, from 22 days to 34 days. Similarly, semi-detached homes have seen a substantial increase in time to sell, jumping from an average of 9 days to 28 days, marking a +211.1% rise. In contrast, condominiums have remained relatively steady, with a slight improvement in days on market, decreasing by -6.4% from 47 to 44 days.
Overall, the Q3 trend highlights a market in transition, driven by shifting buyer preferences. Semi-detached homes and townhomes are experiencing price growth, indicating demand in these segments, while detached homes and condos are becoming more affordable. However, the varied timelines to sell suggest buyers are approaching different property types with varying levels of interest and caution, likely influenced by affordability, inventory, and changing market dynamics.
Average Sale Prices (Q3 2024):
- Detached Home: $730,522
- Semi-Detached Home: $604,065
- Townhouse: $633,250
- Condominium: $512,702
Total Sales (Q3 2024):
- Detached Home: 77
- Semi-Detached Home: 18
- Townhouse: 4
- Condominium: 16
1- Year Trends
Examined both Monthly & Quarterly
In Stratford, quarterly data is a much more accurate picture of the true market trends, due to the low number of sales in some months.
Average Sale Prices
Monthly
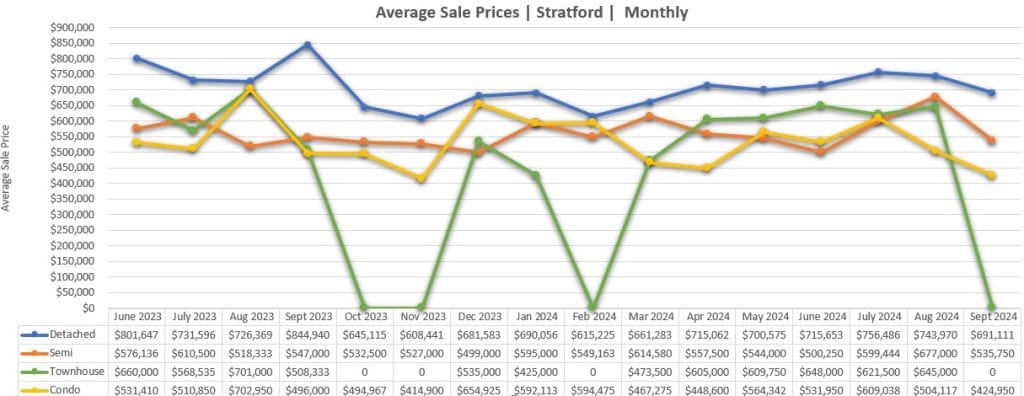
Missing inputs due to lack of sales or single outlier skewing the data.
Quarterly
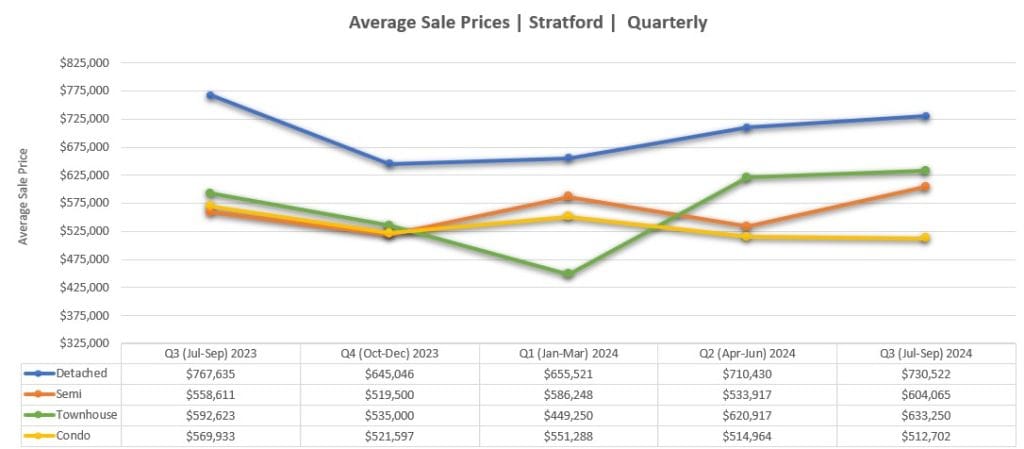
Third Quarter (July-September) year-over-year change from 2023 to 2024:
Detached Home: -4.8%
Semi-Detached Home: +8.1%
Townhouse: +6.9%
Condominium: -10.0%
Number of Sales
Monthly
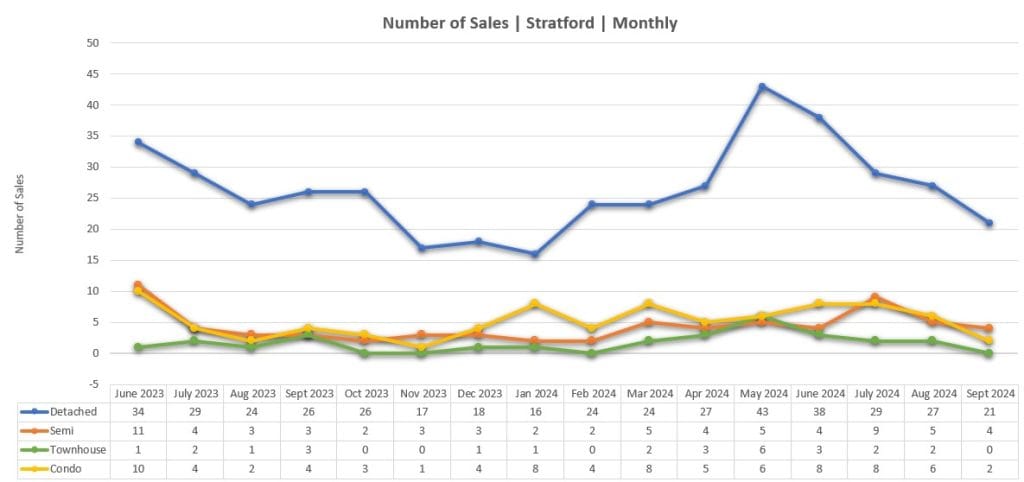
Missing inputs due to lack of sales or single outlier skewing the data.
Quarterly
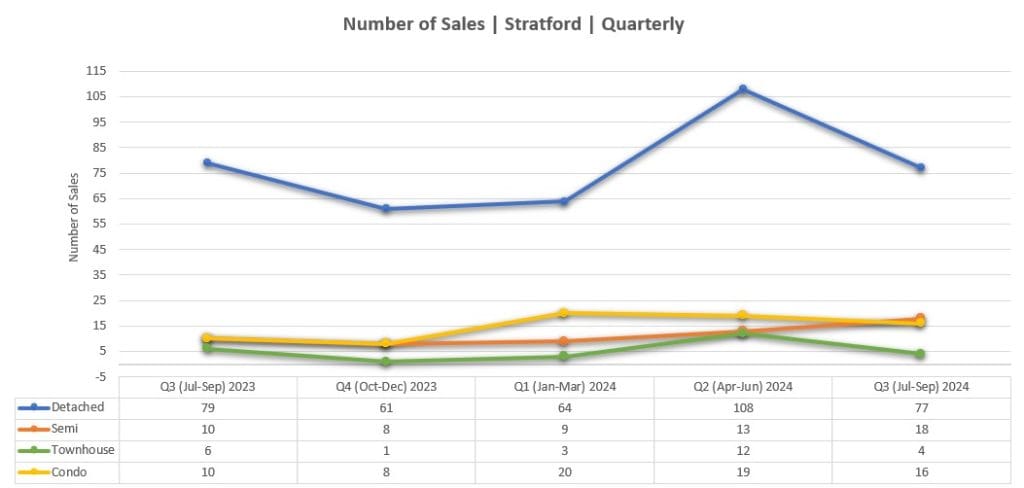
Third Quarter (July-September) year-over-year change from 2023 to 2024:
Detached Home: -2.5%
Semi-Detached Home: +80.0%
Townhouse: -33.3%
Condominium: +60.0%
Price Per Square Foot ($/SQFT)
Monthly
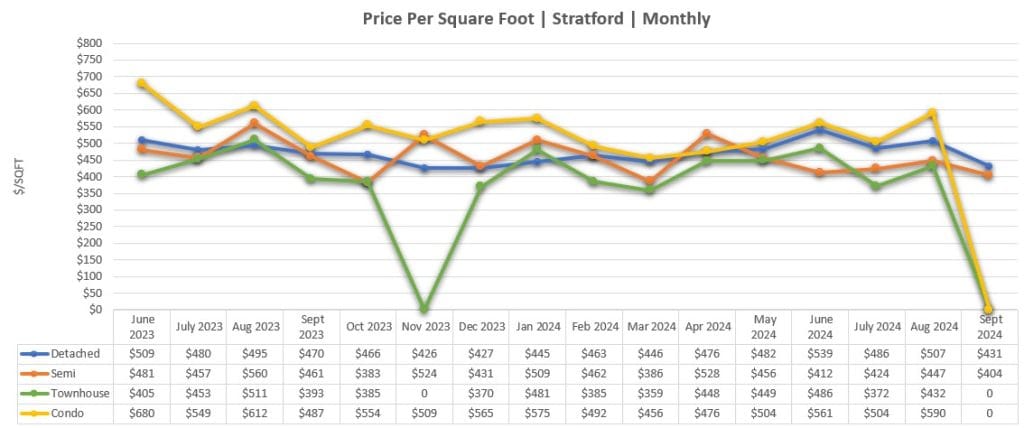
Missing inputs due to lack of sales or single outlier skewing the data.
Quarterly
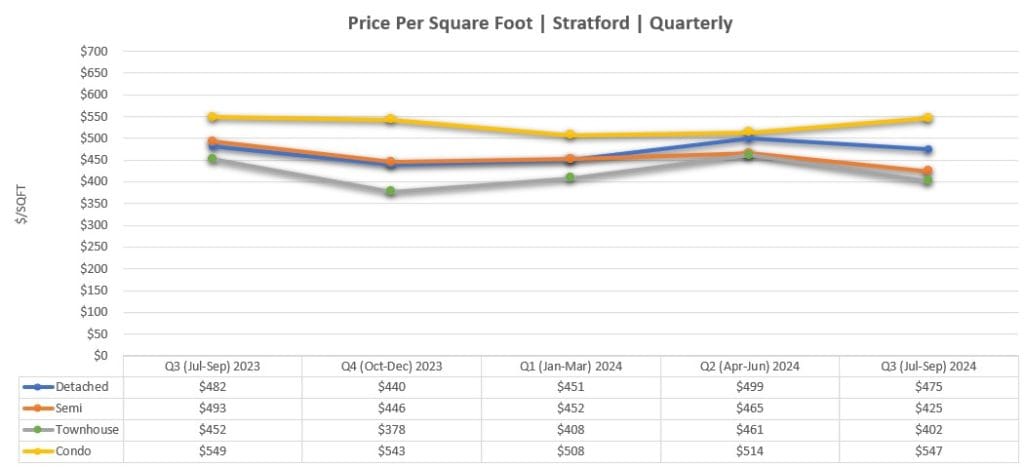
Third Quarter (July-September) year-over-year change from 2023 to 2024:
Detached Home: -1.5%
Semi-Detached Home: -13.7%
Townhouse: -11.1%
Condominium: -0.4%
Percentage Sold Above Asking Price
Monthly
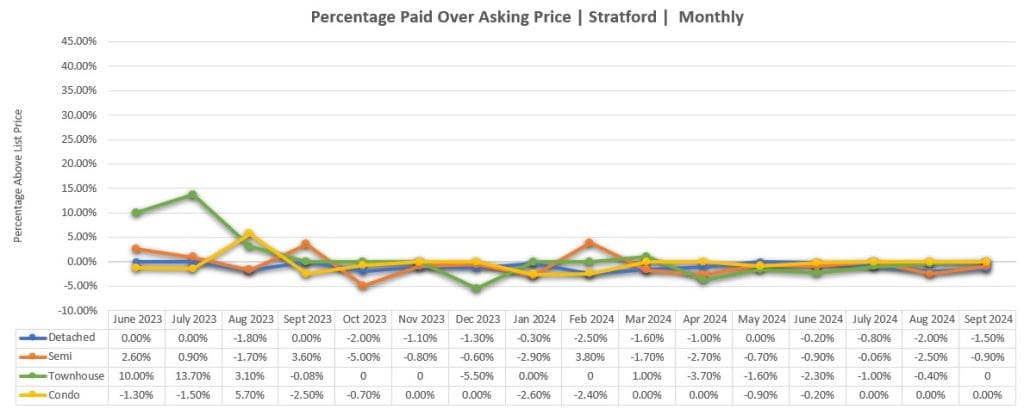
Missing inputs due to lack of sales or single outlier skewing the data.
Quarterly
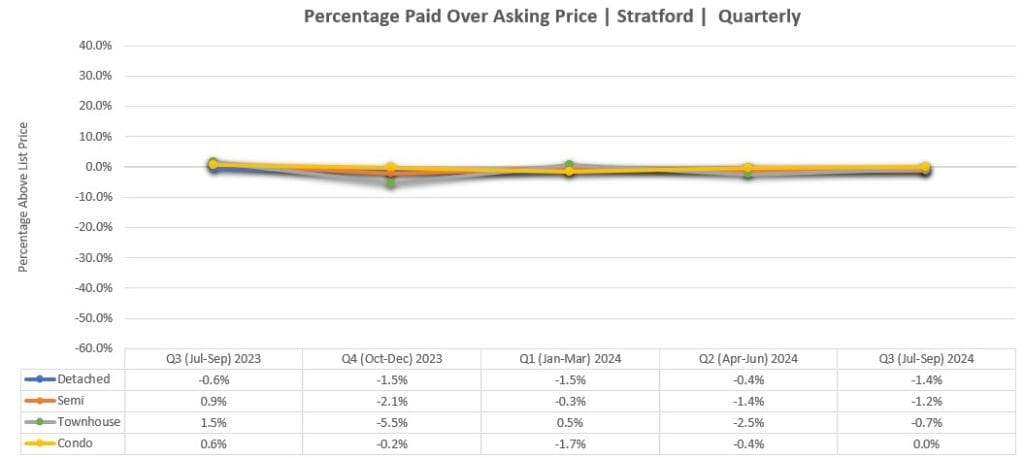
Third Quarter (July-September) year-over-year change from 2023 to 2024:
Detached Home: +138.9%
Semi-Detached Home: -223.6%
Townhouse: -146.4%
Condominium: -100.0%
Days to Sell (Median)
Monthly
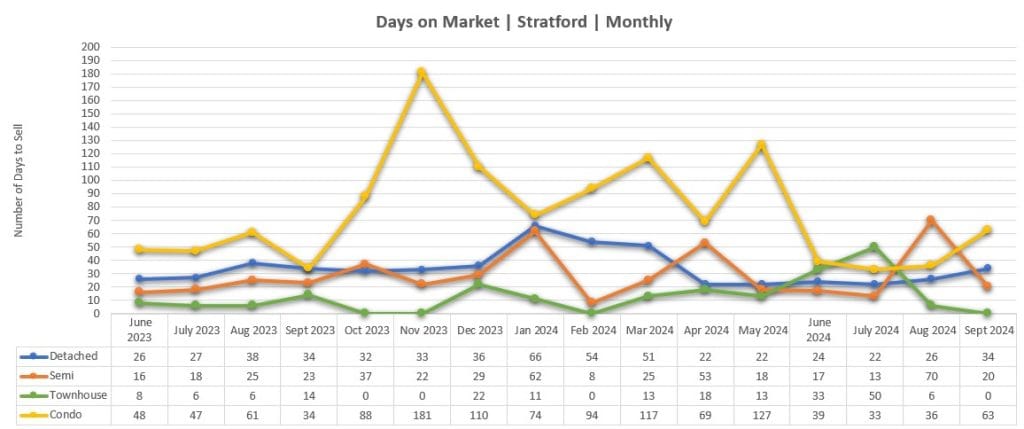
Missing inputs due to lack of sales or single outlier skewing the data.
Quarterly
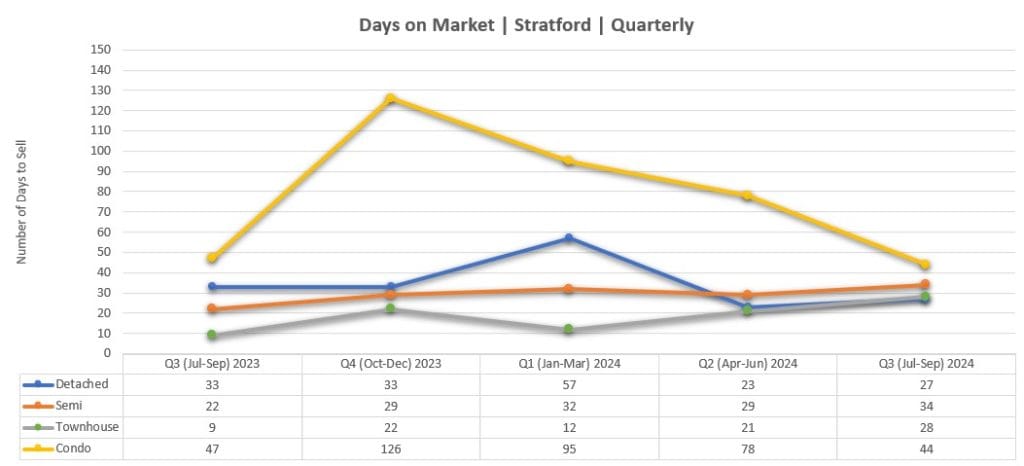
- Detached homes have had a slight decrease to an average of 4 weeks on the market from 5 weeks at this time last year.
- Semi-Detached homes have had an increase to an average of 5 weeks on the market from 3 weeks at this time last year.
- Townhouses are selling on an average of 4 weeks compared to 1 week at this time last year.
- Condos remained consistent with an average of 6 weeks on the market compared to 7 weeks at this time last year.

All statistics gathered independently from Huron Perth Association of REALTORS®.
This publication is not to be copied or duplicated without the express written permission of Roxanne Finn.
This publication is not intended to solicit buyers or sellers currently under contract with a brokerage.